Figure 7.
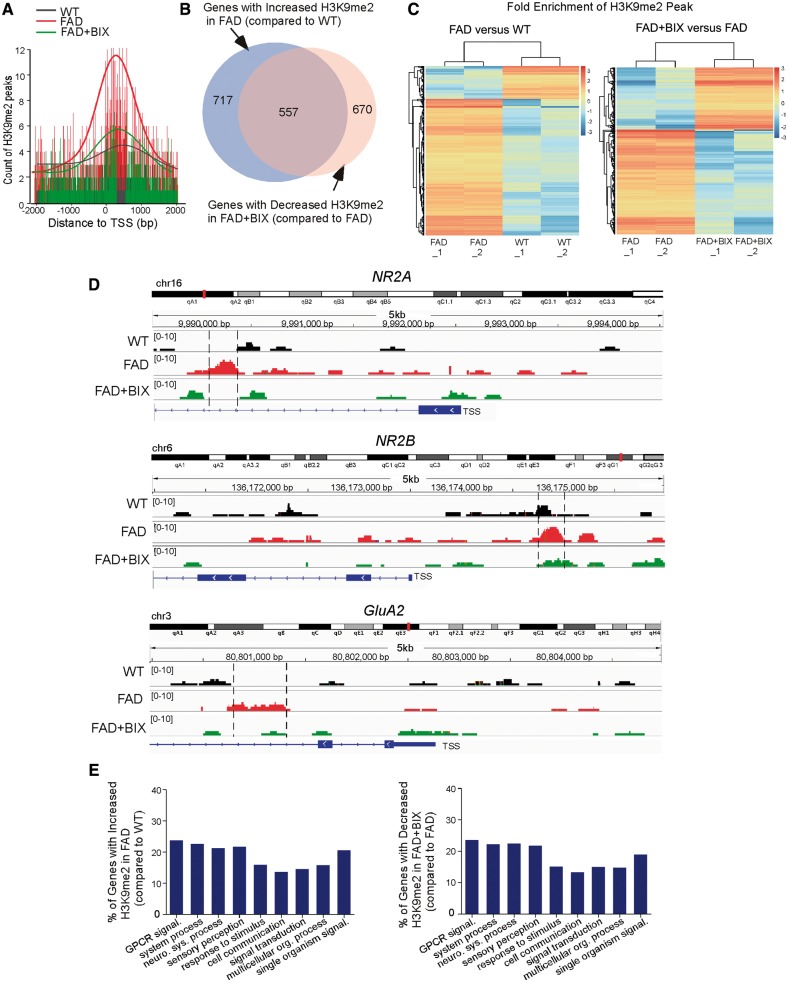
FAD mice exhibited genome-wide increase of H3K9me2 enrichment at genes involved in neural signalling, which was reversed by EHMT1/2 inhibition. (A) Profile plot of H3K9me2-enriched DNA fragment reads around 2000 bp of transcription start site (TSS) across the genome in PFC samples from wild-type mice and FAD mice without or with BIX01294 treatment (1 mg/kg, s.c. 3×). The trend lines are the average of two samples in each group. The lower bars represent the counts of H3K9me2 at the location of the highest part of the peak. (B) Venn diagram illustrating the overlap of genes with increased H3K9me2 enrichment in FAD mice (compared to wild-type) and decreased H3K9me2 enrichment in BIX01294-treated FAD mice (compared to FAD). (C) Hierarchical clustering map showing the fold enrichment of H3K9me2 peaks in FAD versus wild-type mice, and FAD + BIX versus FAD mice. (D) ChIP-seq data showing the enrichment of H3K9me2 around transcription start sites regions of Grin2a/NR2A, Grin2b/NR2B and Gria2/GluA2 genes in PFC from wild-type, FAD and BIX01294-treated FAD mice. The putative H3K9me2 binding sites are highlighted with dotted lines. (E) Enrichment analysis using gene sets derived from the Biological Process Ontology for the genes that had increased H3K9me2 enrichment in FAD mice (compared to wild-type) and decreased H3K9me2 enrichment in BIX01294-treated FAD mice (compared to FAD). ChIPseq experiments were performed with two biological replicates for each group.

