Figure 4.
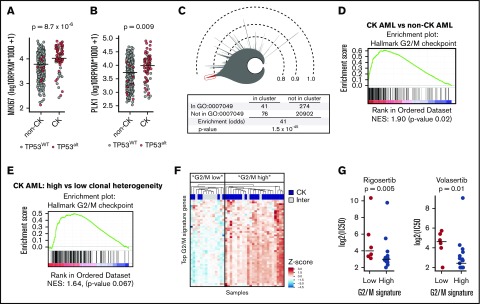
Higher expression of G2/M genes in CK AML and correlation to PLK1 inhibitors sensitivity. MKI67 (A) and PLK1 (B) messenger RNA expression in CK AML compared with non-CK. TP53WT samples are depicted in gray, and TP53alt samples are depicted in red. (C) Icicle representation of all correlated genes in the human AML transcriptome (cohort n = 415) showing that cell-cycle genes (GO:0007049) are highly enriched in the most correlated peak (red), thus indicating that cell-cycle genes are highly correlated in human AML. (D) Gene set enrichment analysis in CK (n = 68) compared with non-CK AML (n = 347) and showing results for the hallmark G2/M checkpoint gene set (supplemental Table 11), which was the single most enriched hallmark set. (E) Gene set enrichment analysis in CK AML comparing samples with higher (n = 55) vs low (n = 13) clonal heterogeneity. Results show the hallmark G2/M checkpoint gene set. (F) Hierarchical clustering performed on samples included in the primary screen using the 50 most enriched genes in hallmark G2/M checkpoint gene set. z scores were applied on rows. (G) Dot plot comparison of rigosertib and volasertib IC50 values (Log2 nM) restricted to CK AML samples classified according to their G2/M signature. Medians are represented by a black line. Inter, intermediate; NES, normalized enrichment score.

