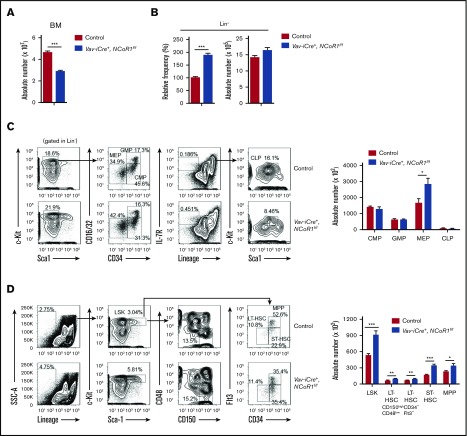
Figure 2.
NCoR1 deletion causes HSCs expansion. (A) Absolute number of BM nucleated cells in control and Vav-iCre+, NCoR1f/f mice (n = 6 per genotype). (B) Relative frequency (left) and absolute number (right) of immature cells (Lin−) in BM from control and Vav-iCre+, NCoR1f/f mice (n = 6 per genotype). (C) Fluorescence-activated cell sorting (FACS) analysis of common myeloid progenitors (CMPs), GMPs, MEPs, and CLPs in control and Vav-iCre+, NCoR1f/f BM cells (n = 6 per genotype). Representative FACS profiles (left panels) and absolute cell numbers (right panel) are shown. (D) FACS analysis of LSK cells, LT-HSCs (CD150highCD48low LSK cells and CD34−Flt3− LSK cells), ST-HSCs, and MPPs in control and Vav-iCre+, NCoR1f/f BM cells (n = 6 per genotype). Representative FACS profiles (left profiles) and absolute cell numbers (right) are shown. Data are mean ± standard error of the mean from 3 independent experiments. *P < .05, **P < .01, ***P < .001.

