Figure 6.
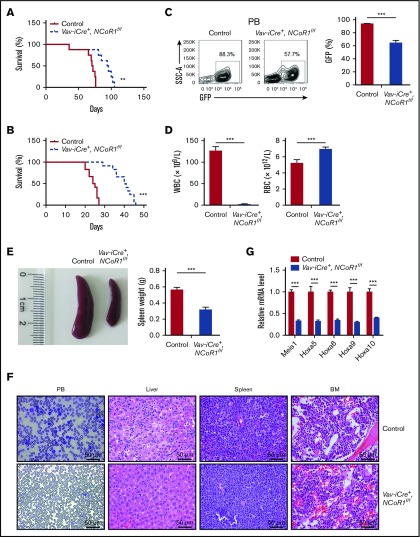
Loss of NCoR1 delays leukemogenesis in MLL-AF9–induced AML. (A) Kaplan-Meier survival curve of recipient mice transplanted with 104 GFP+ cells of the indicated genotypes in the primary transplantation assay (n = 8 per group). (B) Kaplan-Meier survival curve of recipient mice transplanted with 1 million GFP+ cells from primary recipients in the secondary transplantation assay (n = 12 per group). (C) FACS analysis of GFP+ cells in PB of secondary recipients (n = 5 per group) 20 days after transplantation. Representative FACS profiles (upper panel) and the percentage of GFP+ cells (lower panel) are shown. (D) WBC and RBC counts, using a Hemavet 950FS analyzer, in PB of secondary recipients (n = 5 per group) 20 days after transplantation. (E) Spleen weight of secondary recipients (n = 5 per group) 20 days after transplantation (right panel). A representative photograph is shown (left panel). (F) Wright-Giemsa staining of blood smear, and hematoxylin and eosin staining of liver, spleen, and BM from secondary recipients 20 days after transplantation. (G) Real-time qPCR analysis of Meis1, Hoxa5, Hoxa6, Hoxa9, and Hoxa10 in sorted BM leukemia cells (GFP+) of secondary recipients (n = 5 per group) 20 days after transplantation. mRNA levels were normalized to Gapdh expression. Data are mean ± standard error of the mean from 3 independent experiments. **P < .01, ***P < .001.

