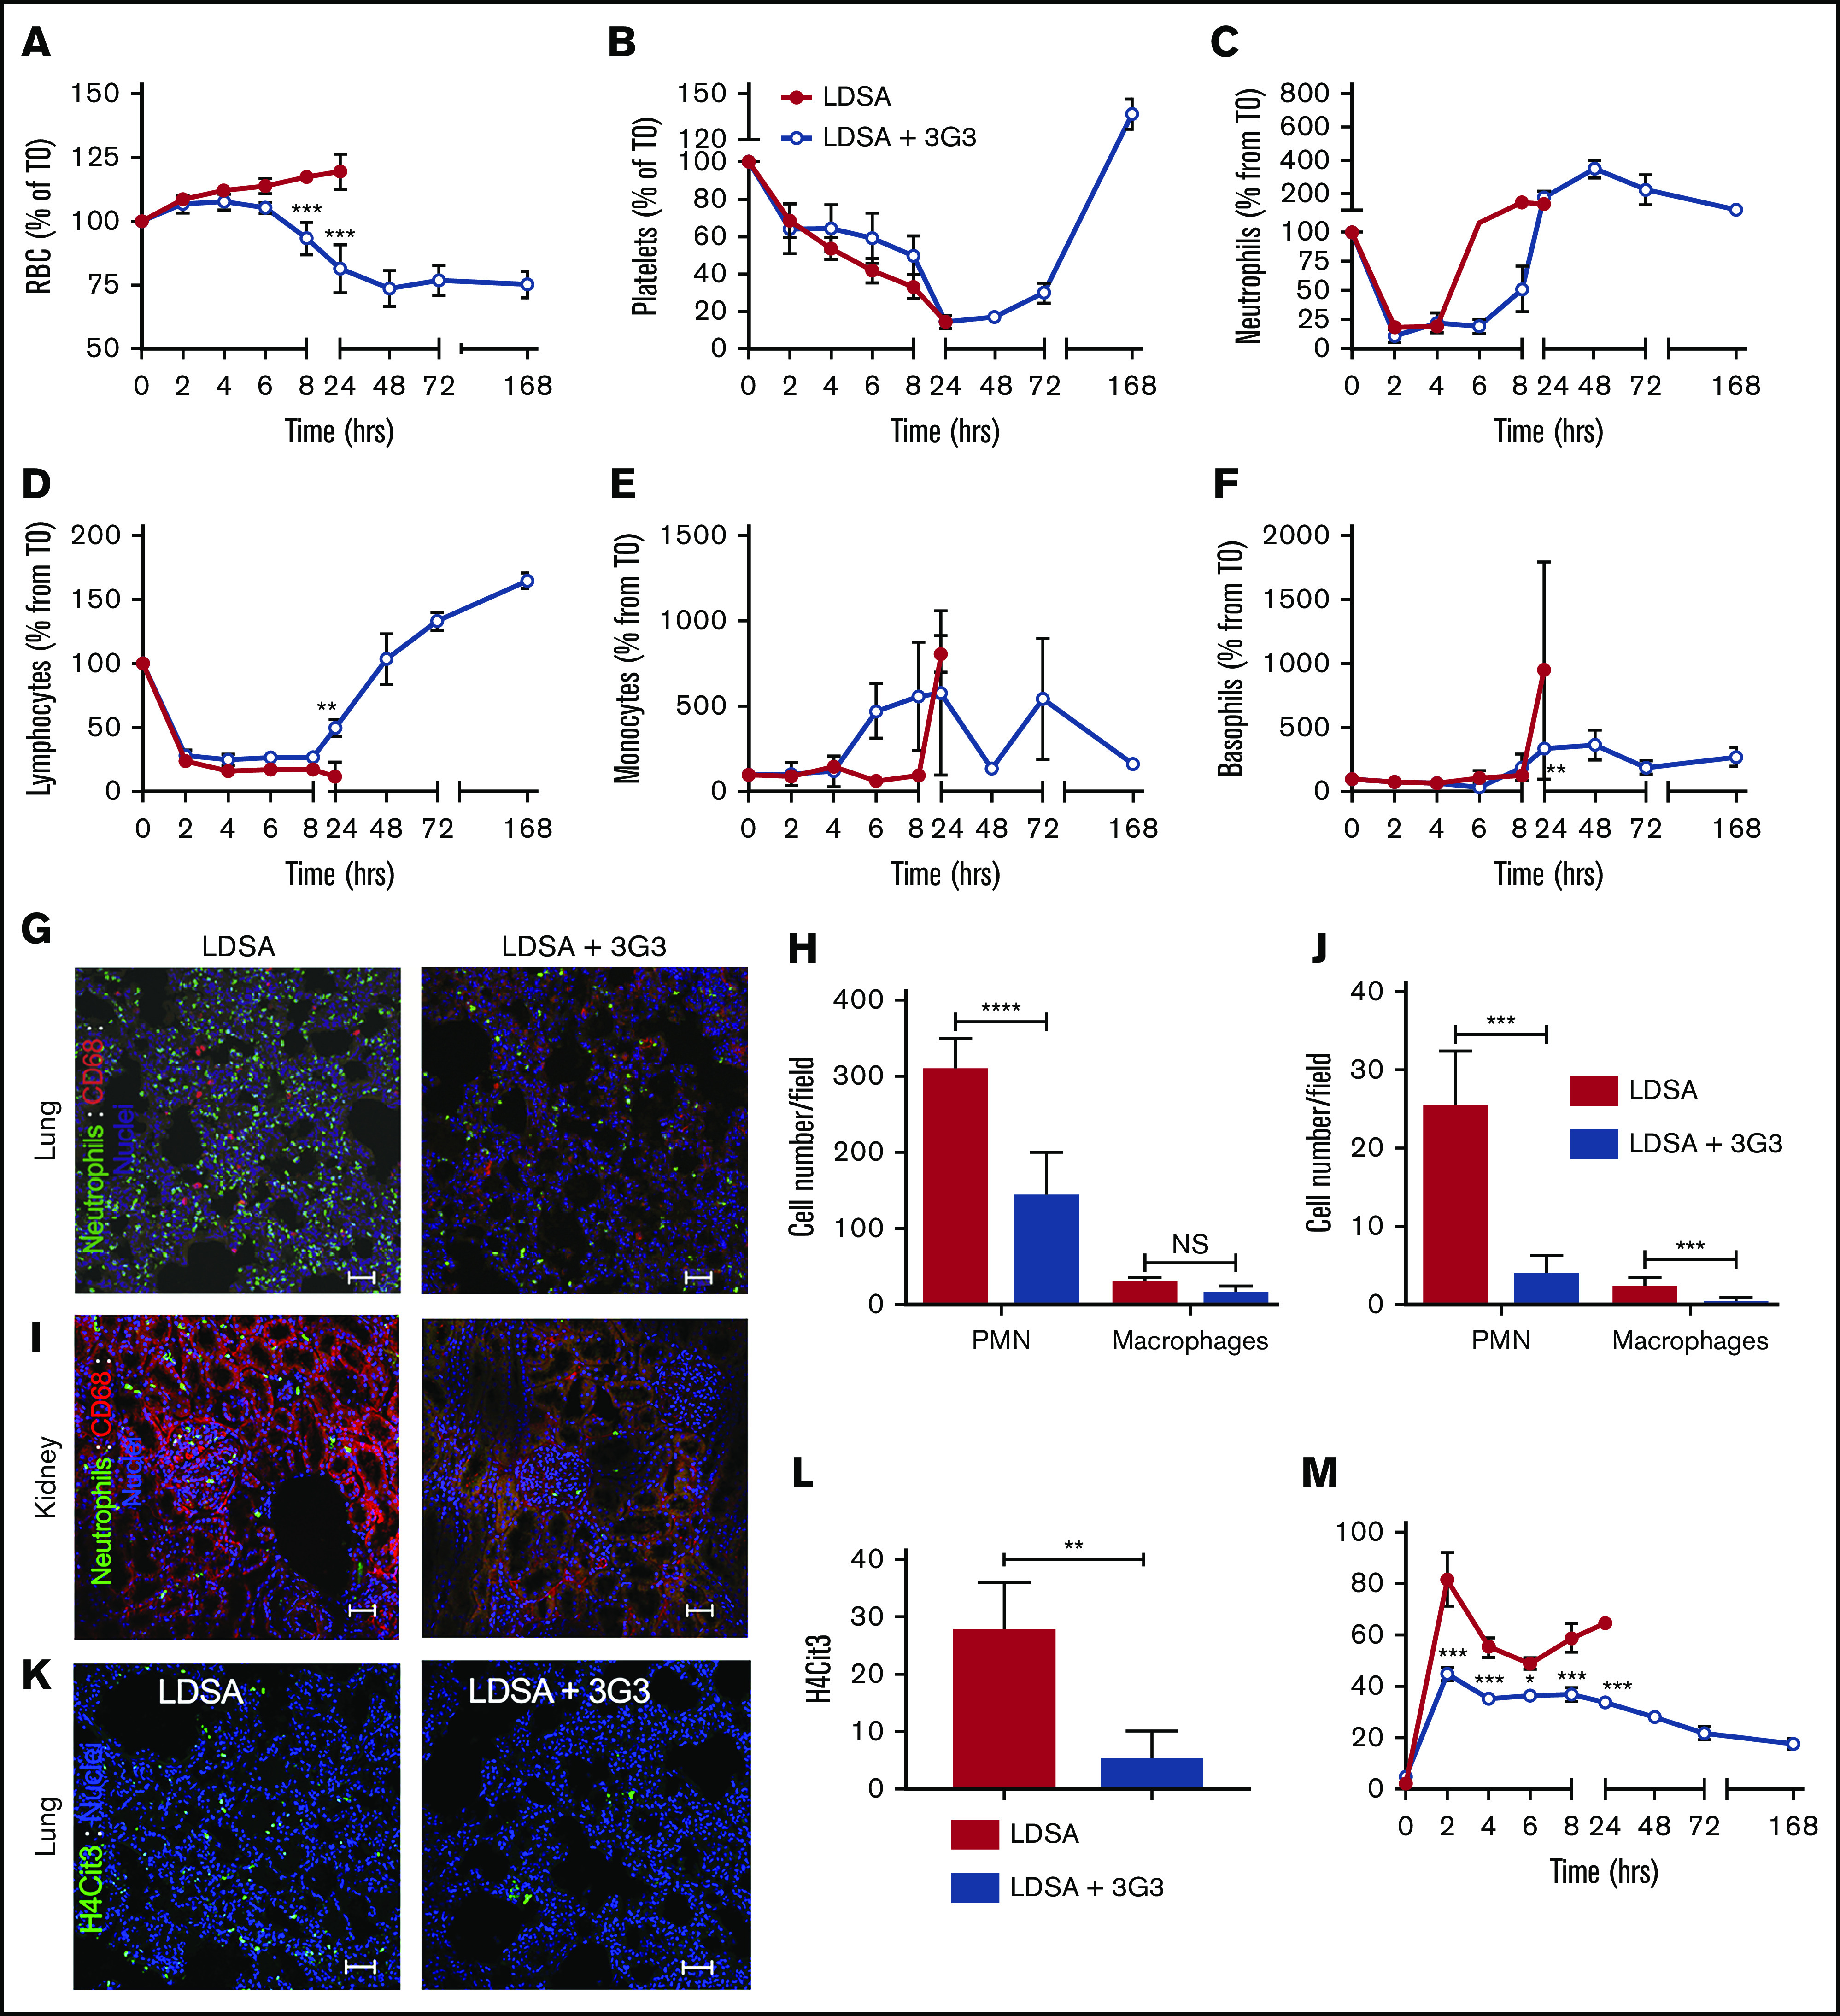
Figure 4.

Effect of pretreatment with 3G3 antibody on blood cells, neutrophil activation, and tissue accumulation following a lethal dose of heat-inactivated S aureus injection in baboons. Time course changes of RBCs (A), platelets (B), neutrophils (C), lymphocytes (D), monocytes (E), and basophils (F) in baboons challenged with LDSA or with pretreatment with 3G3 (LDSA + 3G3). (G) Double immunofluorescence staining of elastase (neutrophils, green) and CD68 (monocytes/macrophages, red) in the lung (top) and kidney (bottom) of baboons challenged with S aureus, without (LDSA; left) or with pretreatment with 3G3 antibodies (LDSA + 3G3; right). Confocal images were captured on a Nikon Eclipse TE2000-U inverted microscope equipped with a Nikon C1 scanning head. Images were acquired and processed using EZ-C1 software (v 3.80; Nikon). Scale bars, 100 µm. (H-J) Quantitation of neutrophils and macrophages in 5 microscopic fields is shown (H, lung; J, kidney). (K) Immunostaining of H4cit3 (green) in the lung of baboons challenged with S aureus without (LDSA; left) or with 3G3 pretreatment (LDSA+3G3; right). (L) Quantitation of H4cit3+ cells in 5 microscopic fields. Images were acquired and processed as described previously. Scale bars, 100 µm. (M) Time course changes of MPO (marker of neutrophil degranulation) enzymatic activity in plasma. (A-F,M) Data are presented as mean ± SEM. Same time point data are compared between untreated and 3G3-pretreated animals using 2-tailed Student t test: *P < .05, **P < .01, **P < .001. (H,J) Data are presented as mean ± SEM. The groups are compared by 2-tailed Student t test: ***P < .001, ****P < .0001. H4cit3, citrullinated histone H4; NS, not significant.
