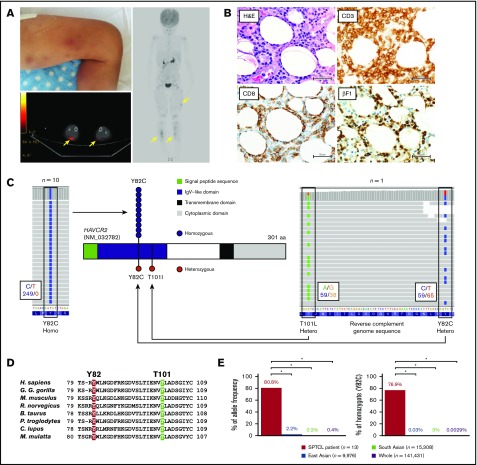
Figure 1.
Individuals with biallelic HAVCR2 germline mutations are highly susceptible to SPTCL. (A) Representative images of a case with SPTCL. Multiple subcutaneous nodules with erythema diffusely involved lower legs (upper left panel). A positron emission tomography/computed tomography scan showed multiple regions with 18 fluorodeoxyglucose (FDG) uptake in subcutaneous soft tissue (yellow arrows). (B) Representative pathological images of SPTCL. On hematoxylin and eosin staining, infiltrating lymphocytes with cellular atypia-rimmed adipocytes (upper left panel). On immunohistochemical staining, these atypical cells were positive for CD3, CD8, and βF1 (TCRβF1) (lower left and right panels). Scale bars, 50 µm. (C) Germline mutations in HAVCR2 (NM_032782), encoding TIM3 protein, detected by WES. Representative images from IGV software showed homozygous p.Y82C mutation in UPN3 (left panel) and compound heterozygous p.Y82C and p.T101I mutations in UPN2 (right panel). In these images, mutated nucleotides (c.245A>G and c.302C>T as shown by reverse complementary DNA sequence) are highlighted in blue and green on sequence reads (horizontal gray bars), respectively. Larger black boxes outline the codons affected by mutations, and the smaller black boxes contain the number of bases with/without substitution, as indicated by the corresponding colors. Functional domains of TIM3, together with sites and zygosities of HAVCR2 mutations, are also shown (middle panel). Among 13 patients, 10 harbored homozygous p.Y82C (blue circles), and 1 patient harbored heterozygous p.Y82C and p.T101I (red circles). (D) Homology of the mutated residues in TIM3 protein. Alignment of amino acid sequences in immunoglobulin variable–like domain of TIM3 among different species is shown (Homo sapiens, Gorilla gorilla gorilla, Mus musculus, Rattus norvegicus, Bos taurus, Pan troglodytes, Canis lupus, and Macaca mulatta). Two residues of TIM3 mutated in SPTCL were highly conserved, as highlighted in red (Y82) and green (T101). (E) Enrichment of HAVCR2 germline mutations (p.Y82C) in SPTCL. Allele frequencies (left panel) and homozygote ratios (right panel) of p.Y82C (c.245A>G) are shown in SPTCL patients from our study, as well as from general populations from the gnomAD dataset. SPTCL patients, East Asians, South Asians, and the whole general population are indicated in red, blue, green, and purple, respectively. *P < .001, Fisher’s exact test.

