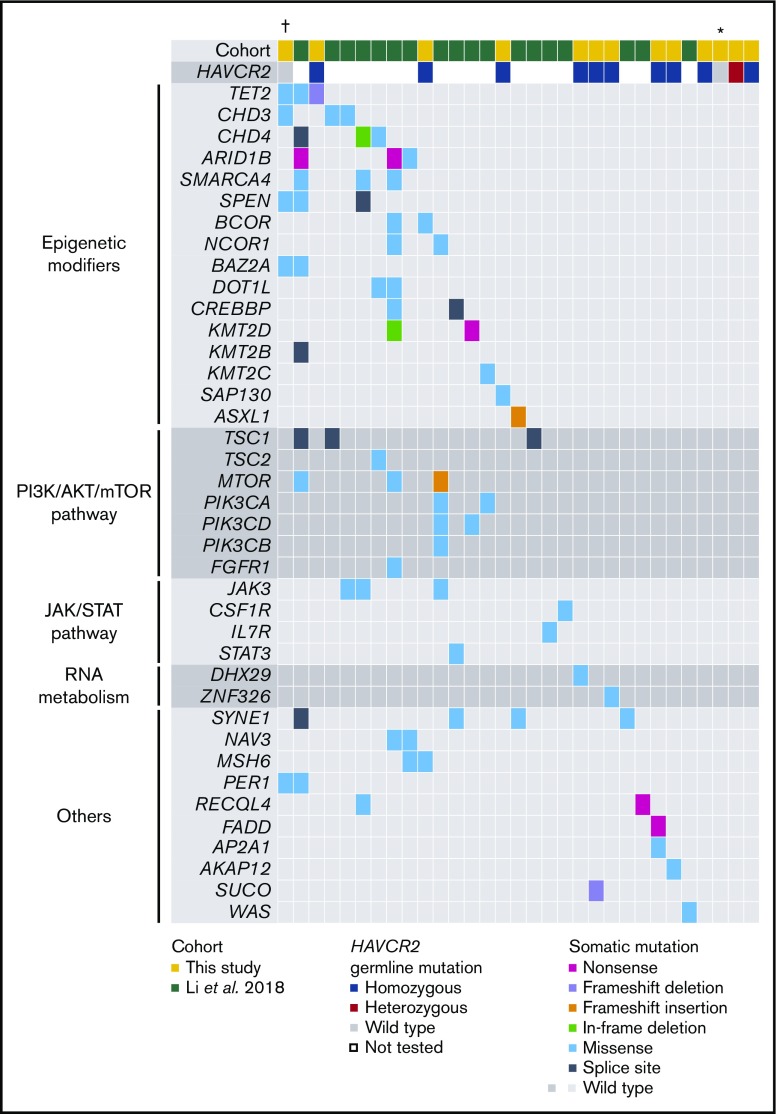
Figure 2.
Landscape of somatic and germline mutations in SPTCL. On the basis of combined results from a previous study4 and this study (supplemental Table 1), the spectrum of somatic and germline mutations in SPTCL is shown. Each column represents an individual case, and each row represents the indicated mutated gene. Genes were assigned to the functional categories shown on the left. The types and status of the mutations are shown by the indicated colors. †Case with HIV infection. *Case with SLE.

