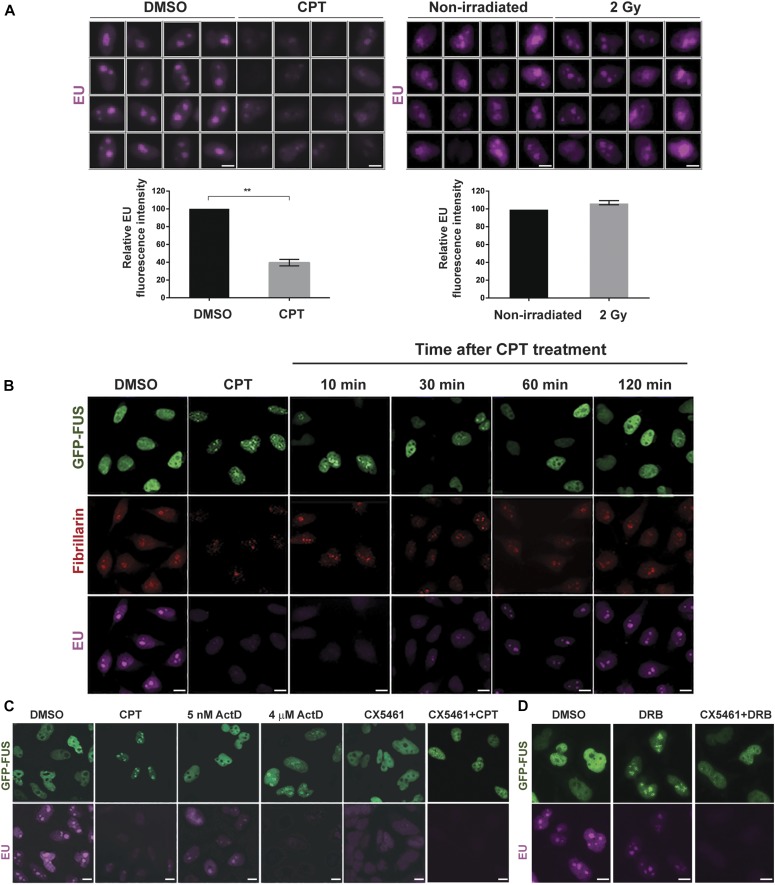
Figure 5. FUS nucleolar relocalisation is reversible and triggered by transcriptional stress.
(A) Top: representative ScanR images of 5-EU pulse labelling in HeLa cells treated with DMSO vehicle or 4 μM CPT for 1 h (left) or following irradiation (2 Gy) (right). Bottom: quantification of EU signal from >500 cells per sample using Olympus ScanR analysis software. Data are the mean (±SEM) of three independent experiments. Statistically significant differences are indicated (two-tailed t test; **P < 0.01). (B) GFP-FUS, fibrillarin, and EU were detected by direct fluorescence (GFP), immunofluorescence (fibrillarin), or Click Chemistry (EU) in HeLa cells treated with DMSO vehicle or 4 μM CPT for 1 h (CPT), and in CPT-treated HeLa cells following subsequent incubation in CPT-free medium for 10, 30, 60, or 120 min. All cells were pulse-labelled with EU for 30 min before fixation. Scale bars, 10 μm. (C) GFP-FUS and EU were detected in HeLa cells treated with either DMSO vehicle, 4 μM CPT for 1 h, actinomycin D (5 nM or 4 μM) for 1 h or 10 μM CX5461 for 3 h. Where indicated, the cells were preincubated with CX5461 for 3 h before a 1-h incubation with 4 μM CPT (CX5461+CPT). Scale bars, 10 μm. (D) GFP-FUS and EU were detected in HeLa cells treated with either DMSO or 100 μM DRB for 30 min. Where indicated, the cells were preincubated with CX5461 for 3 h before a 30-min incubation with 100 μM DRB (CX5461+DRB). Scale bars: (A): 5 μm; (B–D): 10 μm.

