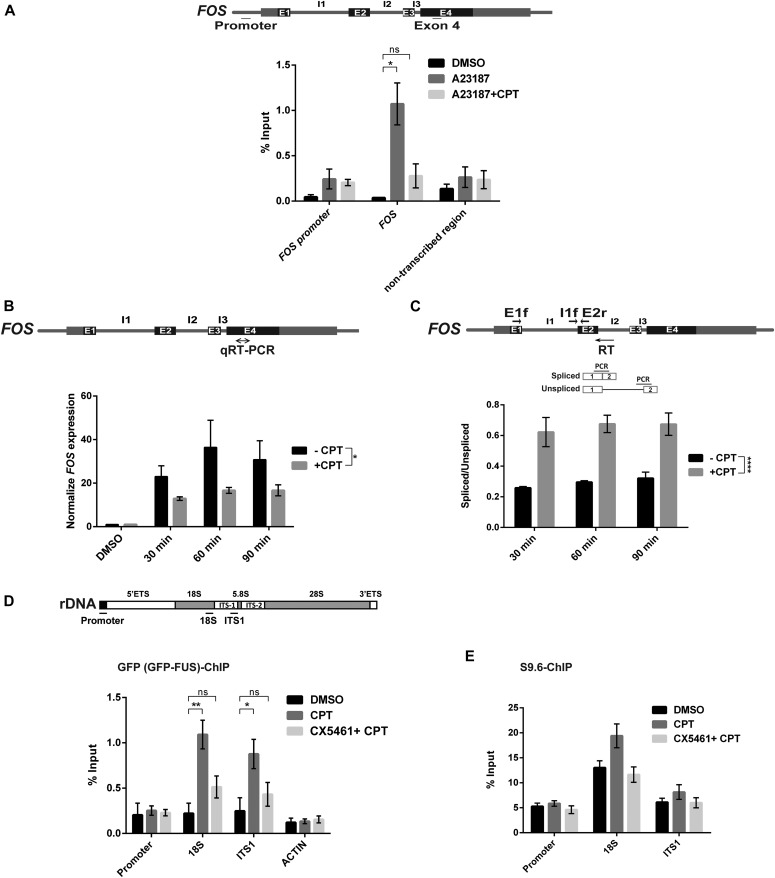
Figure 6. FUS chromatin binding is increased at rDNA following TOP1-induced DNA breakage.
(A) GFP-FUS binding at the indicated regions of FOS was quantified by chromatin immunoprecipitated/qPCR in HeLa cells stimulated with calcium ionophore (5 μM of A23187) for 30 min to induce FOS expression, in the presence or absence of 10 μM of CPT. Top: schematic showing the regions of the FOS promoter and exon 4 amplified by qPCR. A non-transcribed region of chromosome 5 was also amplified and quantified as a control. Data are the mean (±SEM) of four independent experiments. Statistically nonsignificant (“ns”) and significant (two-tailed t test; *P < 0.05) differences are indicated. (B) Quantification of FOS mRNA in serum-starved HeLa cells stimulated with A23187 to induce FOS for the indicated times in the presence of DMSO vehicle (-CPT) or 10 μM CPT. Top: schematic of the FOS gene showing the region amplified by qRT-PCR. mRNA levels were quantified by qRT-PCR and normalized relative to ACTB levels under the same experimental conditions. The normalized value was then expressed relative to the normalized value from DMSO treated cells. Data are the mean (±SEM) of three independent experiments. Statistical significance was determined by two-way ANOVA (*P < 0.05). (C) Quantification of FOS pre-mRNA containing (“unspliced”) or lacking (“spliced”) intron 1 in HeLa cells stimulated as above. Top: schematic of the FOS gene locating the primers used for qRT-PCR and for amplification of FOS pre-mRNA in which intron 1 is spliced (E1f and E2r) or unspliced (I1f and E2r). Data are the mean (±SEM) of three independent experiments. Statistical significance was determined by two-way ANOVA (****P < 0.0001). (D) GFP-FUS binding at the indicated regions of the rDNA loci was quantified by chromatin immunoprecipitated/qPCR in HeLa cells following incubation with DMSO vehicle or 4 μM CPT for 45 min, with or without co-incubation with 10 μM CX5461 (Pol I inhibitor) for 3 h. Top: schematic showing the regions of the rDNA repeats amplified by qPCR are indicated. ACTIN was also amplified and quantified as a control. Data are the mean (±SEM) of four independent experiments. Statistically nonsignificant (“ns”) and significant (two-tailed t test; *P < 0.05, **P < 0.01) differences are indicated. (E) Anti-RNA:DNA hybrid (S9.6 antibody) ChIP-qPCR at the indicated regions of the rDNA locus in HeLa cells after mock treatment (DMSO) or treatment with 4 μM CPT for 45 min with or without preincubation with 10 μM CX5461 for 3 h. Data are the mean (±SEM) of six independent experiments.

