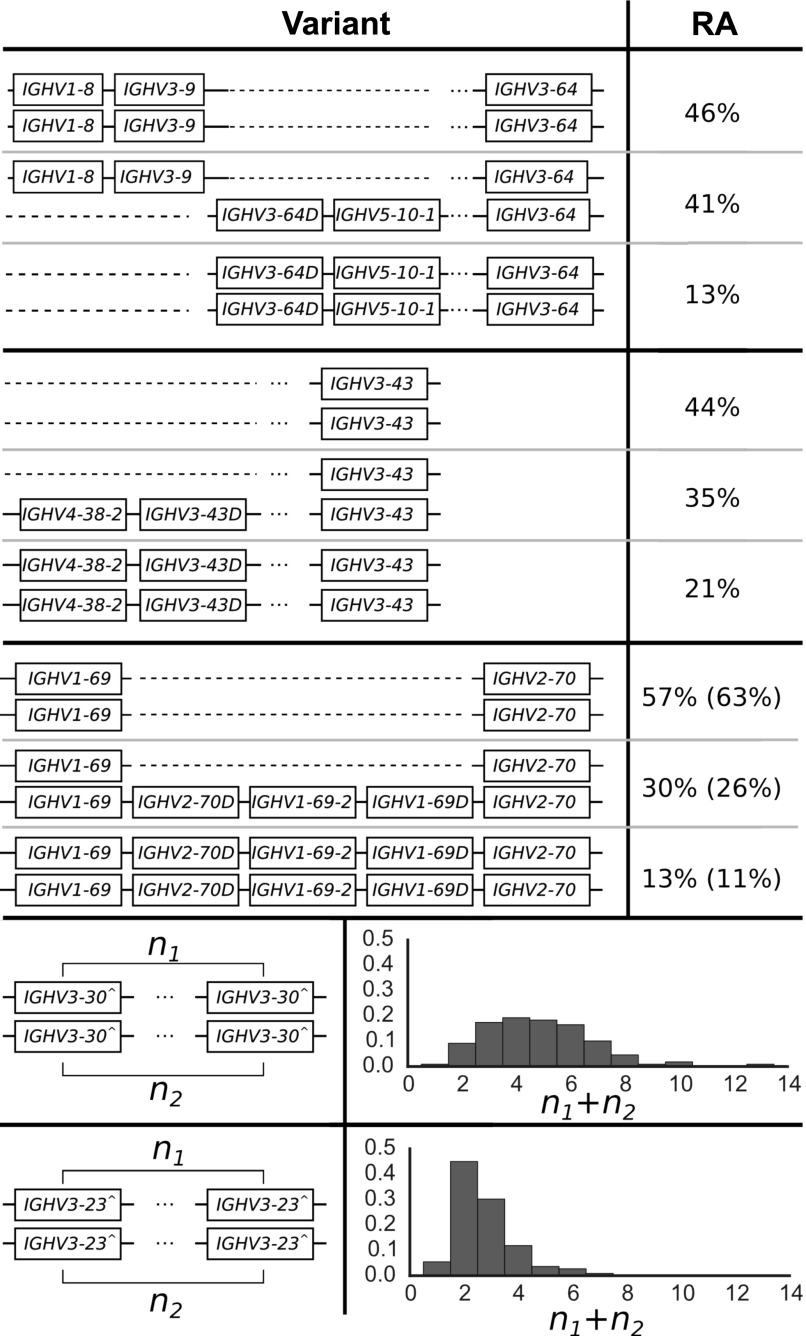
Figure 2. The distribution of IGHV copy number polymorphisms reliably called in our sample.
Schematics in the left column show the polymorphisms, whereas the right column displays the relative abundance (RA) in the sample of 109 individuals. Our data inform the copy number of these genes, whereas the genomic configuration is our best estimate based on previous studies (Sasso et al, 1993; Milner et al, 1995; Sasso et al, 1996; Cho et al, 1997; Pramanik & Li, 2002; Chimge et al, 2005; Boyd et al, 2010; Watson et al, 2013). For the polymorphism involving IGHV1-69, we also show the relative abundances in the full sample of 286 individuals in parentheses. This is because IGHV1-69 and IGHV2-70 are located in the J-distal part of the IGHV locus, making them less likely to be affected by VDJ recombination. Unlike the IGHV polymorphisms that are closer to the J region, we saw negligible differences in copy number estimates for these gene segments in the saliva versus cell-line samples. Note that we use IGHV3-30^ as shorthand for the set {IGHV3-30, IGHV3-30-3, IGHV3-30-5, IGHV3-33} and IGHV3-23^ for {IGHV3-23, IGHV3-23D}. The relative abundances for the CNVs of IGHV3-30^ and IGHV3-23^ are for the total number summed over the two haplotypes in an individual. We estimate the largest haploid number to be 7 for IGHV3-30^ (because the smallest two numbers to sum to 13, the largest copy number called, are 6 and 7) and 4 for IGHV3-23^ (likewise, 4 and 3 are the smallest two numbers to sum to 7). IGHV7-4-1 had inexplicable inflated coverage that prevented us from applying the same analysis to determine its population frequencies. See Supplementary Information (6.6MB, zip) .

