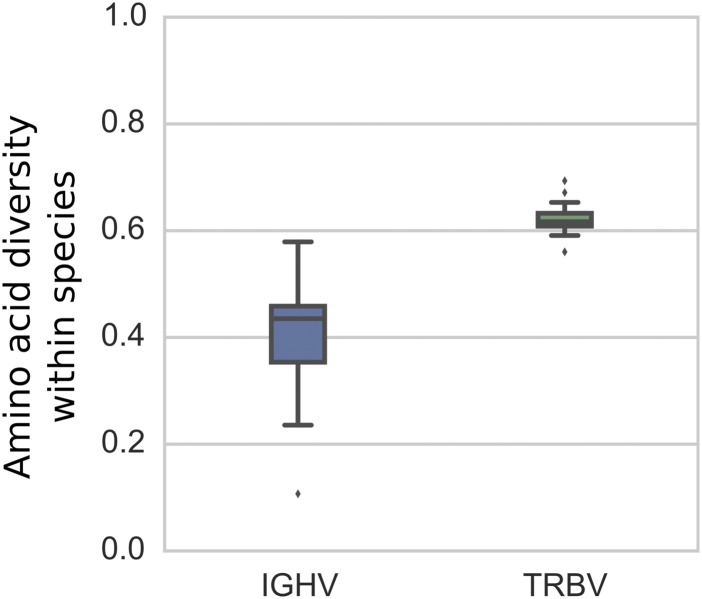
Figure 6. Box plots of within-species average pairwise diversity of IGHV segments and TRBV segments.
The results are based on 13 vertebrate species, including 5 primates, 6 non-primate mammals, 1 reptile, and 1 fish (see Supplementary Text (449KB, pdf) for a complete list of species). For each species, pairwise alignments of all pairs of IGHV segments and all pairs of TRBV segments were performed using ssw (Zhao et al, 2013), an implementation of the Smith–Waterman algorithm (Smith & Waterman, 1981).

