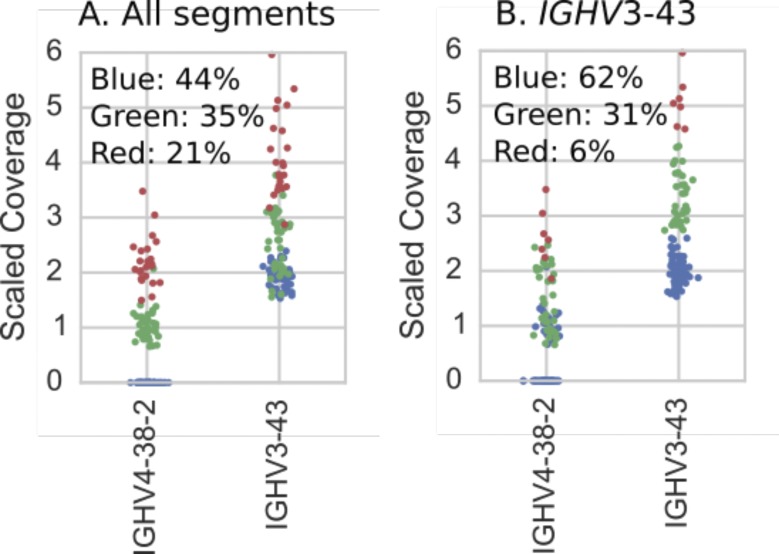
Figure S3. Individuals (dots) colored according to results of hierarchical clustering of copy number estimates (as described in Supplementary Text (449KB, pdf) ) for IGHV4-38-2 and {IGHV3-43, IGHV3-43D} gene segments. Colors correspond to the variants in Fig S7 and the plot titles describe the genes used in the clustering.
(A) Clustering using copy number estimates from both segments. These are the results we report in Fig 2. (B) Clustering using just the copy number estimates for {IGHV3-43, IGHV3-43D}. Note that when only one operationally distinguishable gene is used for performing clustering, the clusters are determined by hard numerical thresholds.

