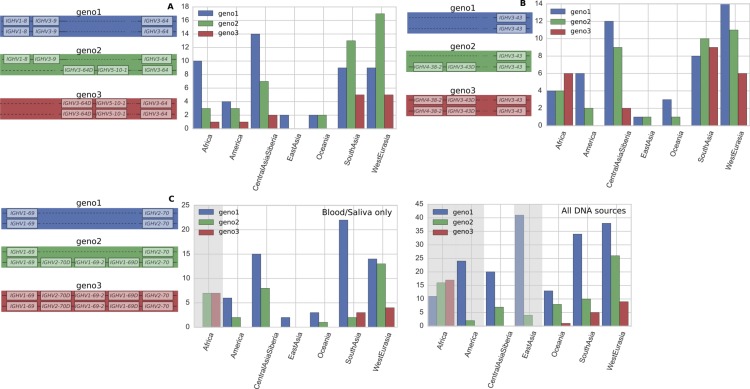
Figure S7. Variant abundances for common IGHV polymorphisms within different geographical regions.
(A) The IGHV polymorphism involving IGHV1-8, IGHV3-9, IGVH5-10-1, and IGHV3-64. (B) The IGHV polymorphism involving IGHV4-38-2, IGHV3-43, and IGHV3-43D. (C) The IGHV polymorphism involving IGHV1-69, IGHV1-69-2, and IGHV2-70. For all graphs, y axis is the number of individuals. Figures are based on the 109 individuals with blood/saliva samples, except for the plot on the right in (C), where because VDJ recombination is not believed to have a marked influence on copy number calls for the segments in the polymorphism, we use the full sample of 286 individuals from all DNA sources. Sample sizes for each region are 14 Africans, 31 West Eurasians, 23 Central Asians—Siberians, 2 East Asians, 27 South Asians, 4 Oceanians, and 8 Native Americans. Grey shading indicates the distribution within a region is significantly different from the global distribution at the 0.01 level in a chi-squared goodness-of-fit test. Our data inform the copy number of these genes, whereas the genomic configuration is our best estimate based on previous studies (see Fig 2).

