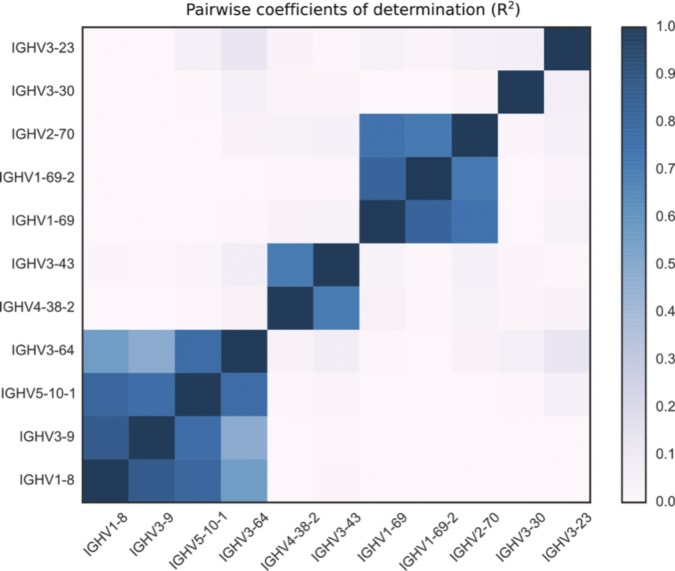
Figure S9. For each pair of segments that appear in any IGHV copy number polymorphism, we calculate the coefficient of determination (also known as R squared) between the scaled copy number estimates at different gene segments over the sample of 109 individuals.
A value of 1 corresponds to perfect correlation, a value of 0 to no correlation. Segments that are not in the same polymorphism have values very close to 0. Note that “IGHV3-23” refers to {IGHV3-23, IGHV3-23D}, “IGHV3-30” to {IGHV3-30, IGHV3-30-3, IGHV3-30-5, IGHV3-33}, “IGHV3-43” to {IGHV3-43, IGHV3-43D}, “IGHV3-64” to {IGHV3-64, IGHV3-64D}, “IGHV1-69” to {IGHV1-69, IGHV1-69D}, and “IGHV2-70” to {IGHV2-70, IGHV2-70D}.

