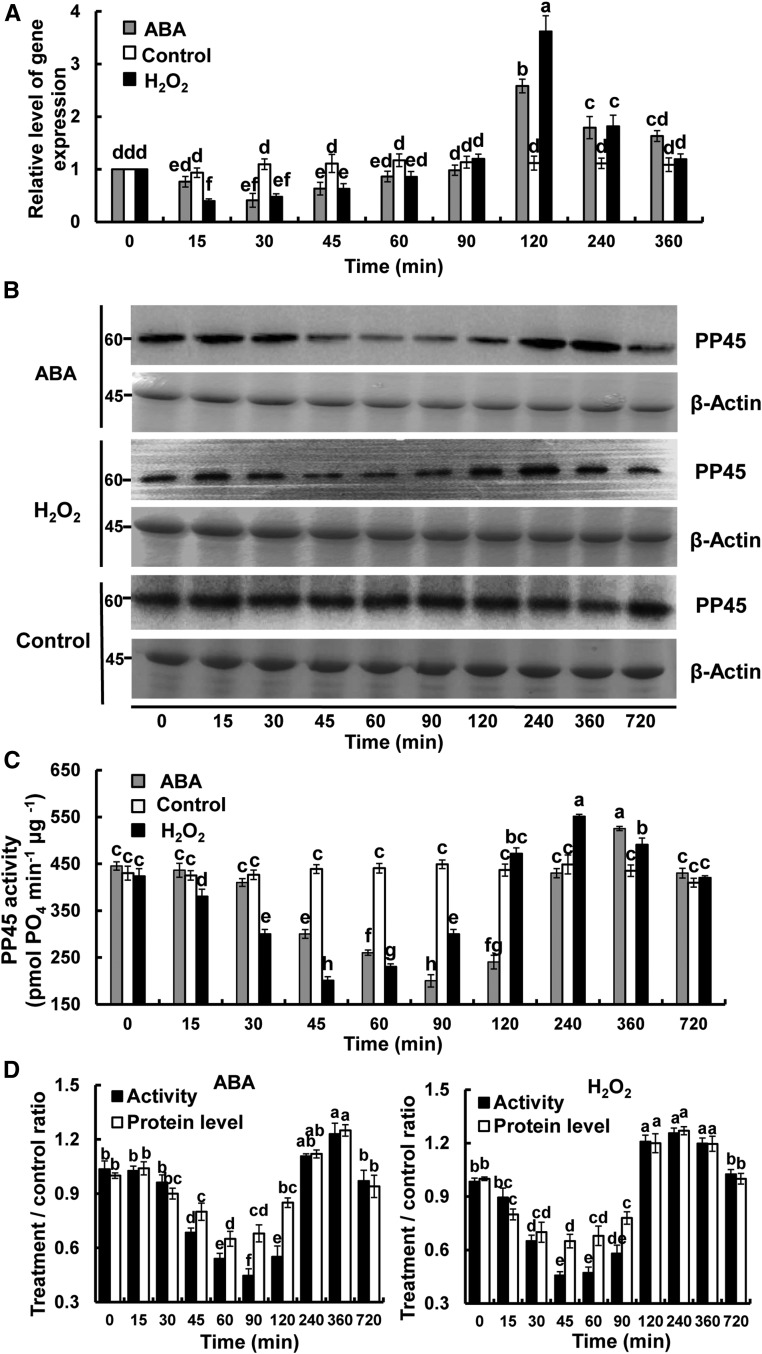
Figure 3.
ABA and H2O2 Regulate the Expression of PP45, the Level of PP45 Protein, and the Activity of PP45.
(A) to (C) Changes in the expression (A), the protein level (B), and the activity (C) of PP45 in leaves of rice plants exposed to ABA (100 μM) or H2O2 (10 mM) treatment for various times as indicated. Relative expression level of PP45 was analyzed by real-time quantitative PCR (A). The level of PP45 protein was analyzed by IB with an anti-PP45 antibody, and β-actin was used as a loading control. Molecular mass markers in kilodaltons are shown on the left (B). The activity of PP45 was measured by the serine/threonine phosphatase assay (C).
(D) The treatment/control ratio of the protein level in (B) and the activity in (C) of PP45. For quantitative analysis of band intensity in (B), the starting point (0 h) was set to 1, and the other points were compared with it. In (A), (C), and (D), values are means ± sem of three independent experiments. Means denoted by the same letter did not significantly differ at P < 0.05 according to Duncan’s multiple range test. In (B), experiments were repeated at least three times with similar results.

