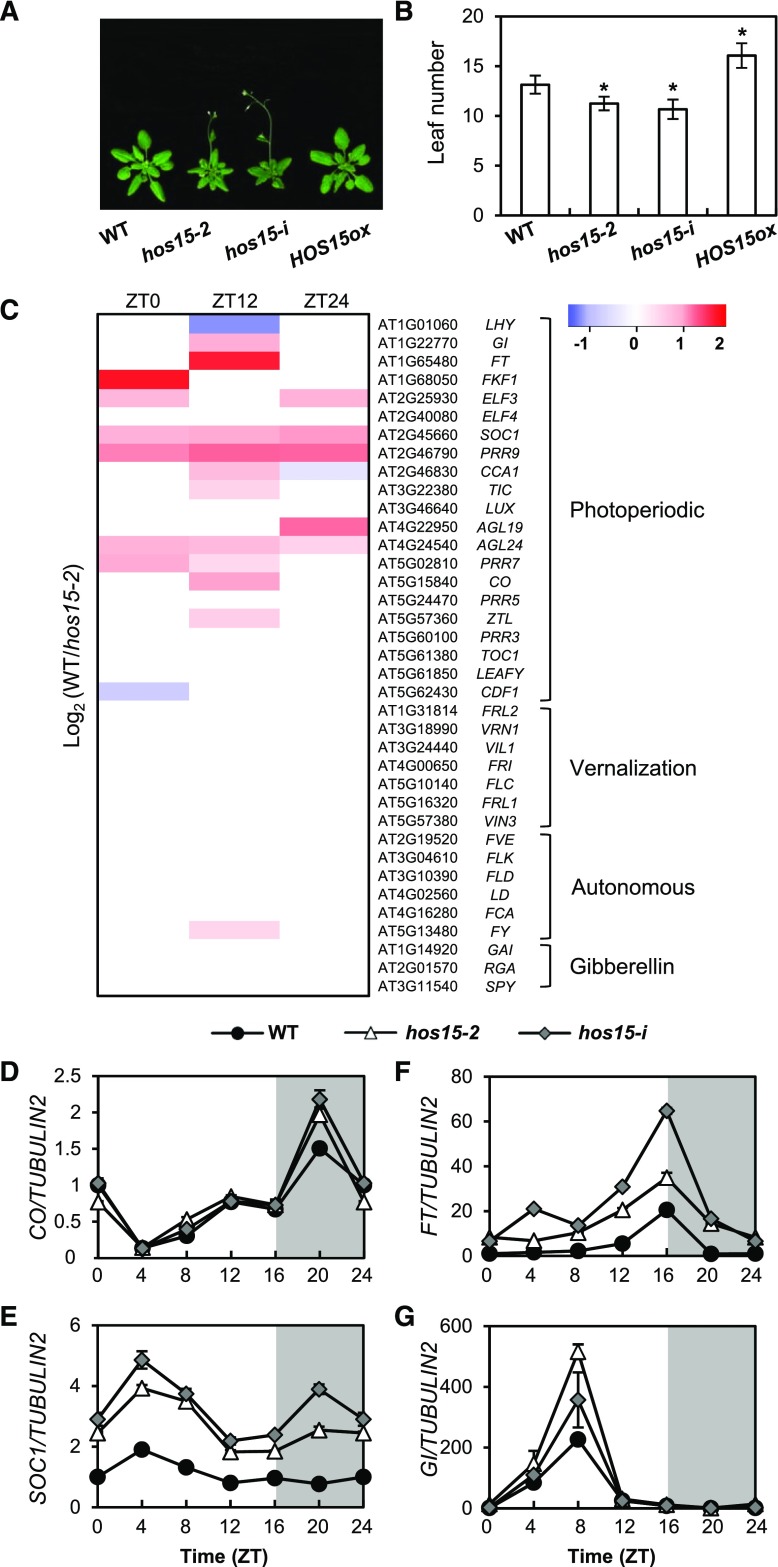
Figure 1.
HOS15 Regulates Photoperiodic Flowering Time.
(A) and (B) Flowering in hos15 mutants and HOS15 overexpressing plants (HOS15-ox) in LD. The numbers of rosette and cauline leaves were counted at bolting as an indicator of flowering time (B). Data are presented as mean ± sd of duplicate experiments, each including at least 15 plants. Asterisks indicate significantly different values from the wild type (*0.01< p-value ≤0.05; Student’s t test).
(C) RNA-seq analysis of 10-d-old hos15-2 plants. Samples were harvested at Zeitgeber Time 0 (ZT0), ZT12, and ZT24. The transcript levels of genes involved in the photoperiodic, vernalization, autonomous, and hormonal flowering pathways are shown.
(D) to (G) Transcript levels of photoperiodic flowering pathway genes in 10-d-old hos15 mutants. Transcript levels of CO (D), SOC1 (E), FT (F), and GI (G) were determined by RT-qPCR and normalized to TUBULIN2. Bars = means ± sd from three biological replicates, each with three technical replicates.

