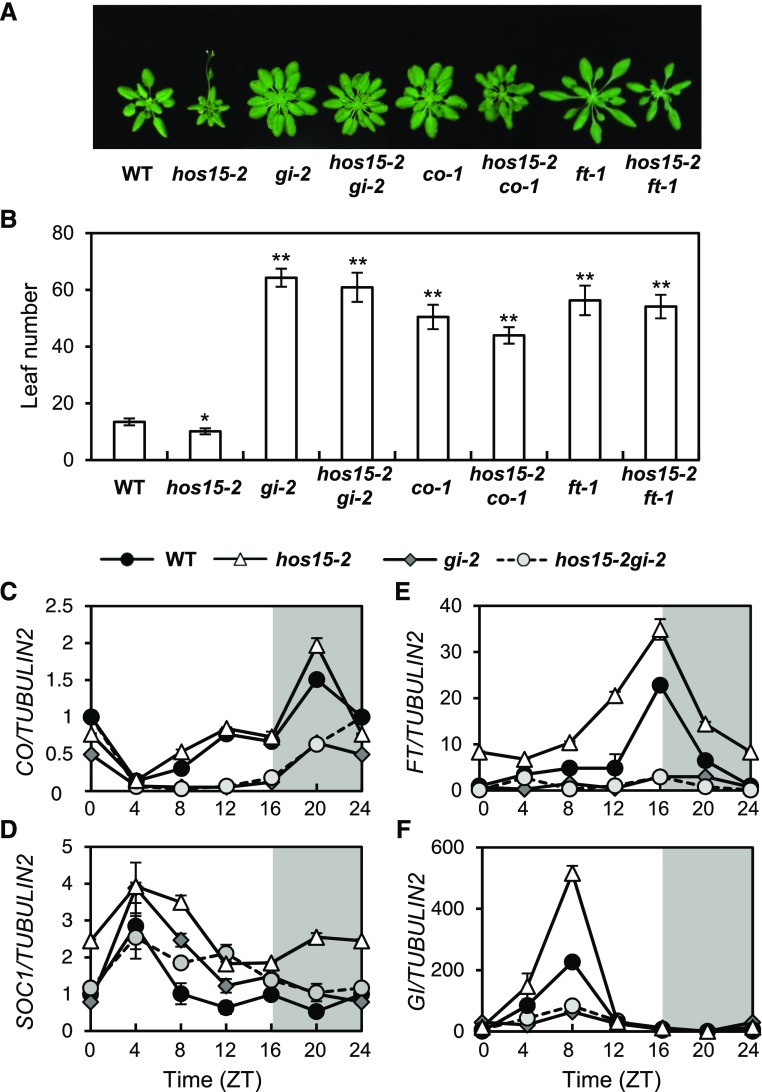
Figure 2.
HOS15 Is Involved in the GI-Mediated Photoperiodic Flowering Pathway.
(A) and (B) Flowering of hos15-2 and other mutants in LD. The numbers of rosette and cauline leaves were counted at bolting as an indicator of flowering time (B). Data are presented as means ± sd of three independent experiments, each including at least 10 plants. Asterisks indicate significantly different values from the wild type (*0.01 < p-value ≤ 0.05; **p-value < 0.01; Student’s t test).
(C) to (F) Transcript abundance of photoperiodic flowering genes in hos15-2 and other mutants. CO (C), SOC1 (D), FT (E), and GI (F) transcript abundances were determined by RT-qPCR and normalized to TUBULIN2. Bars = means ± sd from three biological replicates, each with three technical replicates.

