Figure 3.
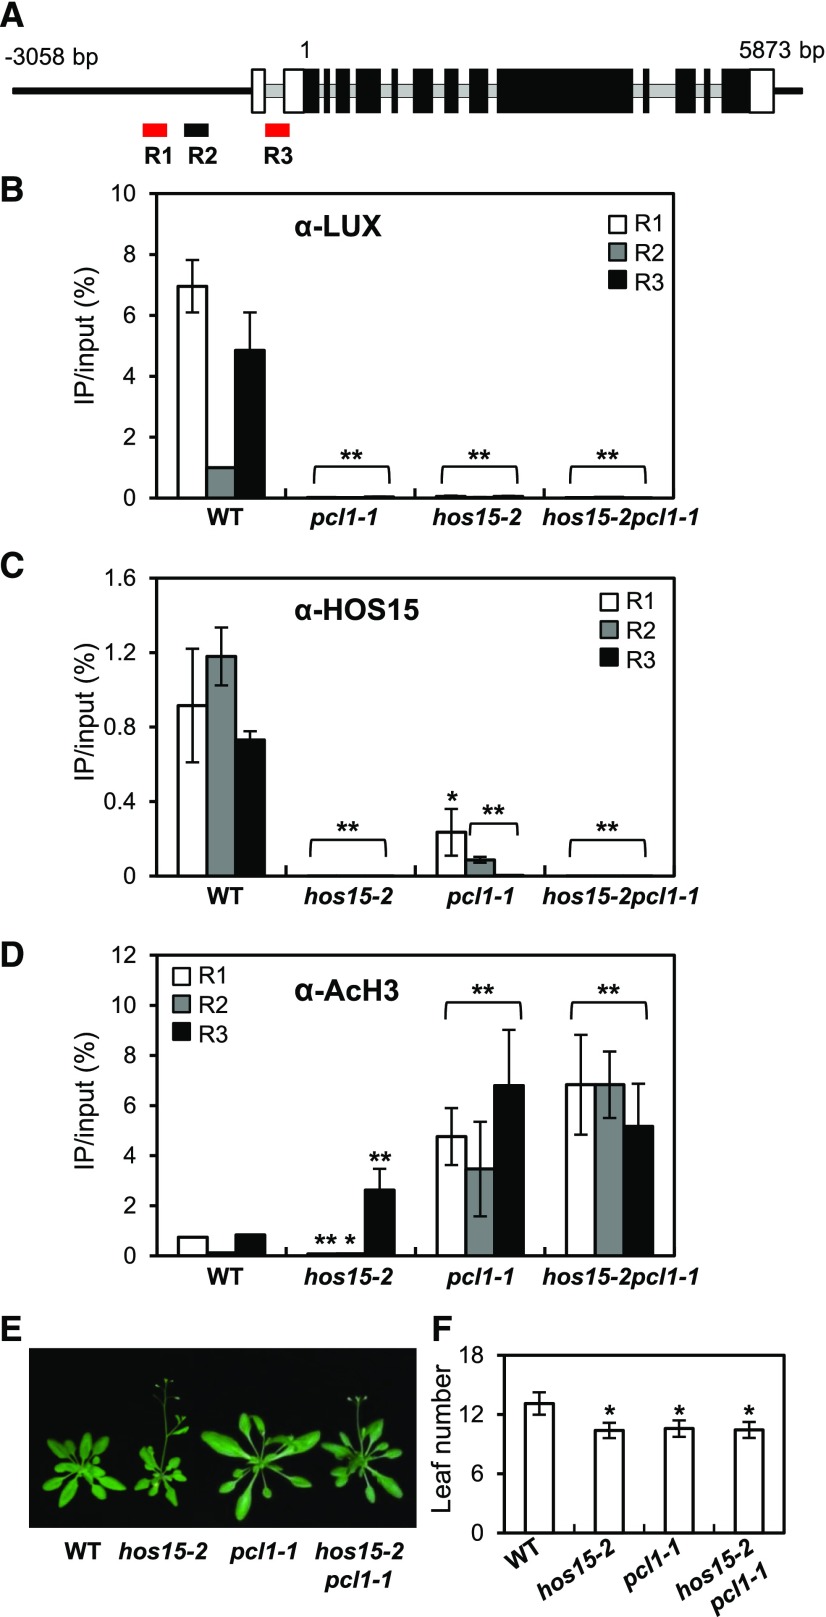
HOS15 Represses GI Expression through De-Acetylating the Histones at the GI Promoter.
(A) Schematic representation of the GI locus and the locations of the three amplicons used for ChIP analysis. R1 and R3 (red) include LUX binding sites. Introns are indicated by gray lines, and exons are indicated by boxes; black boxes indicate the translated coding sequences, and white boxes indicate the untranslated regions.
(B) to (D) ChIP analysis of 2-week-old wild type, hos15-2, pcl1-1, and hos15-2 pcl1-1 plants. Samples were harvested at ZT8. Genomic DNA was immunoprecipitated by α-LUX (B), α-HOS15 (C), or α-AcH3 (D) antibodies. Results were normalized to the input DNA (n = 3), and values represent means ± sd from three biological replicates, each with three technical replicates. Asterisks indicate significantly different values from the wild type (*0.01 < p-value ≤ 0.05; **p-value < 0.01; Student’s t test).
(E) and (F) pcl1-1 and hos15-2 pcl1-1 plants growing under LD were photographed (E), and flowering time was quantified by counting rosette and cauline leaves at bolting (F). Data are presented as means ± sd from two biological replicates, each including at least 15 plants. Asterisks indicate significantly different values from the wild type (*0.01 < p-value ≤ 0.05; **p-value < 0.01; Student’s t test).

