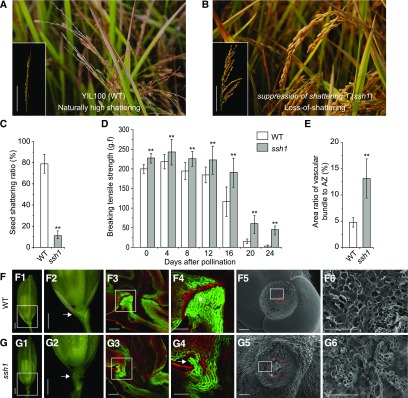
Figure 1.
Comparison of Seed Shattering and Floral AZ Morphology in the Wild Type and the ssh1 Mutant.
(A) and (B) Phenotypes of mature wild-type (YIL100) and ssh1 rice in the field. Panicles of the wild type and the ssh1 mutant are respectively illustrated in the lower left corners. Bars = 10 cm.
(C) Comparison of the seed shattering ratio of the mature wild type and the ssh1 mutant. Values are means ± sd (n = 10 main panicles).
(D) Comparison of the BTS in the wild type and the ssh1 mutant on the day after pollination and every 4 d thereafter during seed development. The g.f is the gravitational unit of force. Values are means ± sd (n = 50 grains).
(E) Comparison of the area ratio of the vascular bundle to AZ in the wild type and the ssh1 mutant. Values are means ± sd (n = 10 grains).
In (C) to (E), two-tailed Student’s t tests were used to compare the wild type and the ssh1 mutant (**, P < 0.01; Supplemental File 2).
(F) and (G) Characterization of floral AZ morphology in the wild type (F) and the ssh1 mutant (G). (F1) and (G1) show the spikelets. The white boxes indicate the junction between the seed and the pedicel and are enlarged in (F2) and (G2), where the arrows indicate the position of the AZ. (F3) and (G3) show the fluorescence images of longitudinal sections across the flower and pedicel junction. (F4) and (G4) are enlargements of the white boxes in (F3) and (G3), respectively. Arrows point to the AZ in the wild type or the corresponding region in the ssh1 mutant. (F5) and (G5) show SEM photographs of the seed bases where the pedicels attach. The red circles indicate vascular bundles. (F6) and (G6) are magnifications of the white boxes in (F5) and (G5), respectively. The surface of the seed base in the wild type is smooth, whereas the surfaces in the ssh1 mutant are broken and rough. Bars = 1 mm in panels (1) and (2), 100 μm in panels (3) and (5), and 50 μm in panels (4) and (6).

