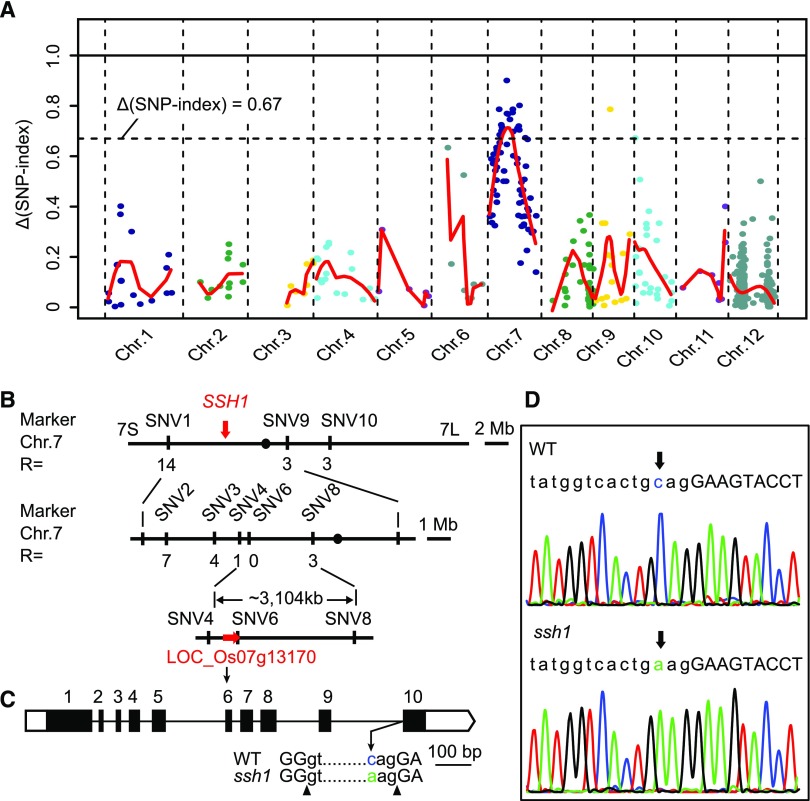
Figure 2.
Mapping of SSH1.
(A) Δ(SNP-index) plot of the whole genome generated using MutMap. The red curves represent Δ(SNP-index) plot regression lines.
(B) The mapping location of the SSH1 gene was narrowed down to an ∼3104-kb interval between SNP markers SNV4 and SNV8 using 72 recessive F2 individuals. It was found to cosegregate with the SNP SNV6, which is located in the ninth intron of LOC_Os07g13170. The vertical red arrow indicates the location of SSH1. The horizontal red arrow represents the gene LOC_Os07g13170.
(C) The exon-intron structure of LOC_Os07g13170 and the location of the SNP SNV6. Black boxes represent exons, white boxes represent UTRs, and thin black lines indicate introns. Uppercase letters and lowercase letters below the gene structure represent exons and introns, respectively. Blue and green lowercase letters represent the C in the wild type and the A in the ssh1 mutant, respectively. Black triangles indicate the 5′ and 3′ splicing sites of the ninth intron of LOC_Os07g13170.
(D) The C-to-A point mutation (SNV6) in LOC_Os07g13170, detected using Sanger sequencing. Lowercase letters and uppercase letters above the DNA sequencing peak chromatograms represent the 9th intron and the 10th exon of LOC_Os07g13170, respectively.

