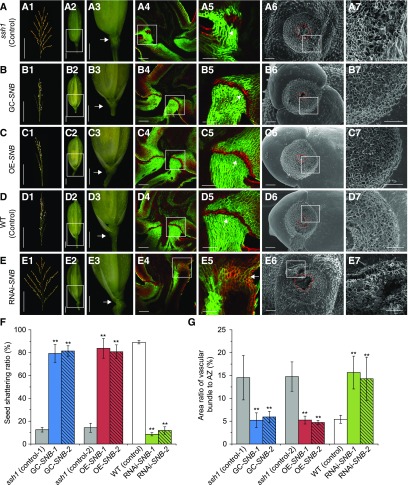
Figure 3.
Characterization of Seed Shattering in the GC-SNB, OE-SNB, and RNAi-SNB Transgenic Plants.
(A) to (E) The morphological analyses of the ssh1 mutant (control; [A]), the GC-SNB transgenic plants (B), the OE-SNB transgenic plants (C), the wild type (control; [D]), and the RNAi-SNB transgenic plants (E). (A1), (B1), (C1), (D1), and (E1) show the seed shattering phenotypes on the main panicle. (A2), (B2), (C2), (D2), and (E2) show the spikelets. The white boxes indicating the junction between the seed and the pedicel are magnified in (A3), (B3), (C3), (D3), and (E3), respectively, in which arrows indicate the position of the AZ. (A4), (B4), (C4), (D4), and (E4) show fluorescence images of longitudinal sections across the flower and pedicel junction. The white boxes are magnified in (A5), (B5), (C5), (D5), and (E5), respectively, and the arrows point to the AZ or corresponding regions. (A6), (B6), (C6), (D6), and (E6) are SEM photographs of the seed base. The red circles indicate the vascular bundles. (A7), (B7), (C7), (D7), and (E7) are magnifications of the white boxes in (A6), (B6), (C6), (D6), and (E6), respectively. Bars = 50 μm in panels (5) and (7), 100 μm in panels (4) and (6), 1 mm in panels (2) and (3), and 10 cm in panel (1).
(F) Comparison of seed shattering ratios. Values are means ± sd (n = 10 main panicles).
(G) Comparison of the area ratios of vascular bundle to the AZ of the seed bases. Values are means ± sd (n = 10 grains).
In (F) and (G), two-tailed Student’s t tests were used to compare the transgenic lines and the corresponding controls (**, P < 0.01; Supplemental File 2).

