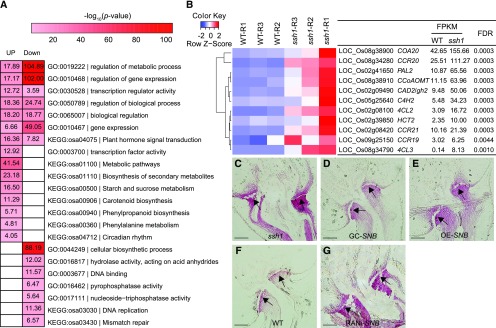
Figure 8.
SNB Negatively Regulates Lignin Biosynthesis and Metabolism.
(A) GO and KEGG analysis of 1403 upregulated and 999 downregulated genes in the young panicles (0–4 cm) of the wild type and the ssh1 mutant.
(B) Hierarchical clustering of 11 DEGs involved in lignin biosynthesis. The average fragments per kilobase of exon per million mapped reads (FPKM) value of all three biological replicates is shown.
(C) to (G) Comparison of lignin deposition in the pedicel junction at spikelet developmental stage Sp8, revealed using phloroglucinol staining. The arrows indicate the AZ. Bars = 100 μm.

