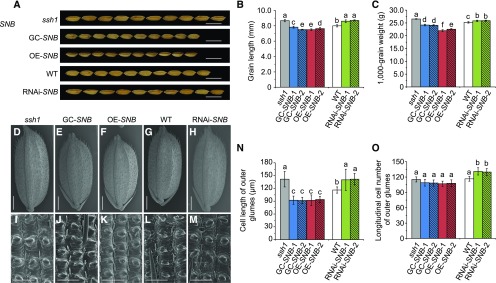
Figure 9.
The ssh1 Mutation Positively Regulates Seed Size and Grain Weight.
(A) Comparison of seed size between the wild type, the ssh1 mutant, and the GC-SNB, OE-SNB, RNAi-SNB transgenic plants. Bars = 1 cm.
(B) Grain length of the wild type, the ssh1 mutant, and the GC-SNB, OE-SNB, and RNAi-SNB transgenic plants. Values are means ± sd (n = 30 grains).
(C) The 1000-grain weight of the wild type, the ssh1 mutant, and the GC-SNB, OE-SNB, and RNAi-SNB transgenic plants. Values are means ± sd (n = 10 plants).
(D) to (H) SEM images of grains from the wild type, the ssh1 mutant, and the GC-SNB, OE-SNB, and RNAi-SNB transgenic plants. Bars = 1 mm.
(I) to (M) SEM images of the lemma outer epidermis cells from the wild type, the ssh1 mutant, and the GC-SNB, OE-SNB, and RNAi-SNB transgenic plants. Bars = 100 μm.
(N) and (O) Comparison of the longitudinal cell lengths and cell numbers of the outer glumes in the wild type, the ssh1 mutant, and the GC-SNB, OE-SNB, and RNAi-SNB transgenic plants. Values are means ± sd (n = 10 grains).
In (B), (C), (N), and (O), different letters denote significant differences (P < 0.01) determined using Tukey’s honestly significant difference analysis (Supplemental File 2).

