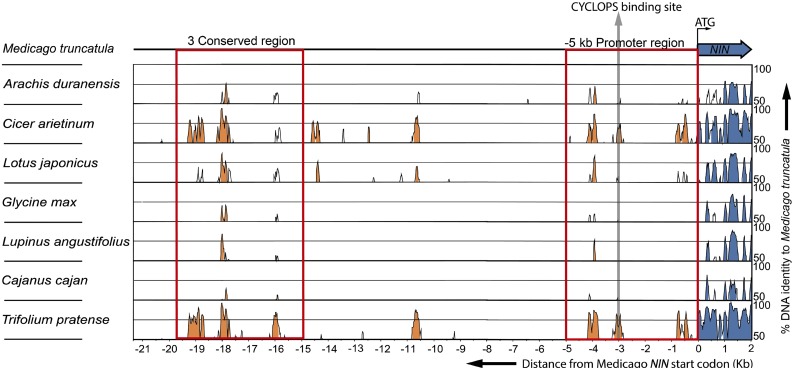
Figure 3.
mVISTA Alignment of Genomic DNA Sequences Including 2 kb from the Start Codon of NIN and 5′-Upstream Regions from Eight Legume Species.
Peaks indicate the level of identity with Medicago on a scale of 50 to 100%. Identities lower than 50% were not scored. The figure shows 2 kb of each NIN sequence downstream of the start codon (blue) and the 5′ upstream DNA sequence (orange). The red rectangle on the right next to the NIN coding sequence indicates the –5 kb promoter region. The red rectangle on the left indicates the 3C. The gray arrow shows the putative CYCLOPS binding site.

