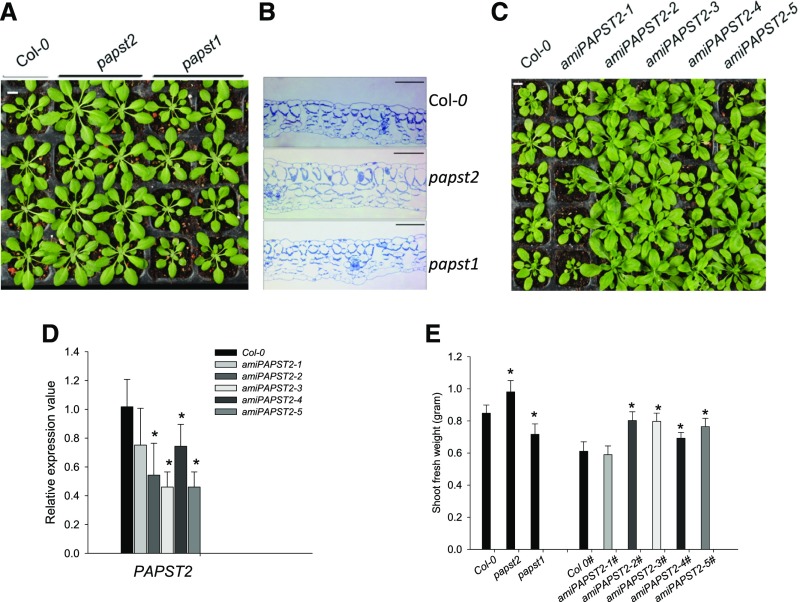
Figure 4.
Phenotypes of the papst2 T-DNA Insertion Mutant and amiRNA Lines.
(A) The papst2 T-DNA insertion line shows larger rosettes than the wild type (Col-0) and papst1 mutant. Bar = 1 cm.
(B) Anatomical cross-sections of rosette leaves of papst2 compared with the wild type (Col-0) and papst1 showing increased cell size in the papst2 mutant. Bar = 100 µm.
(C) Phenotype of amiPAPST2 plants. The larger growth phenotype depends on the reduction in PAPST2 transcript level. The amiRNA lines 1 and 4 resemble the wild type. Plants with highest reduction in PAPST2 transcript levels (lines 2, 3, and 5) exhibit larger rosettes than the wild type. Bar = 1 cm.
(D) Determination of the PAPST2 transcript level in 5-week-old amiRNA lines by quantitative RT-PCR. Relative gene expression values are normalized to the wild type (set to 1). Data show means ±sd, (n = 3). Asterisks indicate significant differences compared with the wild-type Col-0 (Student´s t test, P < 0.05). Both papst2 and amiPAPST2 plants were grown in soil under short day conditions for approximately four weeks.
(E) Shoot fresh weight of papst2 knockout and amiPAPST2 plants. Plants were grown for 5 weeks in soil under a short day light cycle in a controlled environmental chamber. Data show means ±sd (n = 9). The amiPAPST2 plants were cultivated in different growth chambers (marked with #) from papst2 and had their own Col-0 control. Asterisks indicate significant differences compared with the respective wild types (Student´s t test, P < 0.05).

