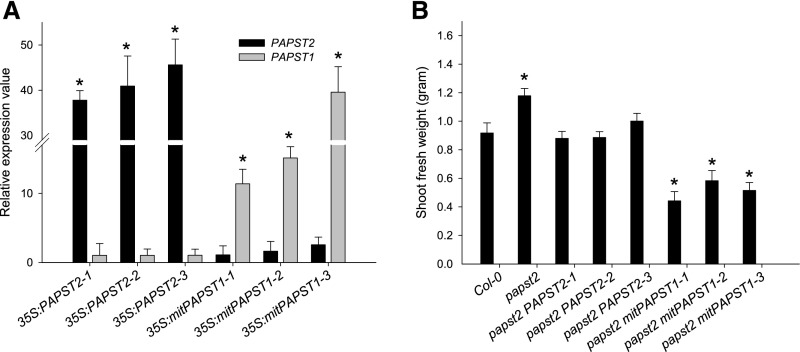
Figure 5.
Complementation of papst2 by PAPST1 and PAPST2.
(A) Expression of PAPST2 and PAPST1 in papst2 lines complemented by 35S:PAPST2 or 35S:mitPAPST1. PAPST2 and PAPST1 transcript levels in rosette leaves of 5-week-old mutant plants were determined by quantitative RT-PCR. Relative gene expression values are given compared with the wild type Col-0 = 1. Data show means ±sd (n = 3).
(B) Shoot fresh weight of the wild type, papst2, and complemented transgenic plants overexpressing PAPST2 and mitPAPST1. Plants were grown for 5 weeks in soil under a short day light period in a controlled environmental chamber. Data show means ±sd (n = 7).
Asterisks in (A) and (B) indicate significant differences compared with the wild-type Col-0 (Student´s t test, P < 0.05).

