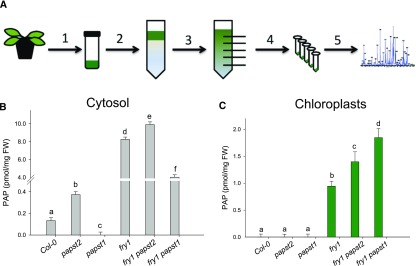
Figure 8.
Concentrations of PAP in the Cytosol and Chloroplasts of papst1, papst2, fry1, fry1 papst1, and fry1 papst2 Mutants Compared with the Wild Type, as Detected by NAF.
Workflow for NAF of plant extracts.
(A) PAP concentrations in the cytosol (B) and chloroplasts (C) of papst1, papst2, fry1, fry1 papst1, and fry1 papst2 calculated based on the relative subcellular distribution of PAP and the respective absolute values. Data show means from three pools of plants (6 g fresh weight each) grown in two independent experiments. Error bars indicate the SD of the mean. Different letters indicate significant differences among means based on t tests at P < 0.05. FW = fresh weight; PAP, 3′-phosphoadenosine 5′-phosphate.

