Figure 4.
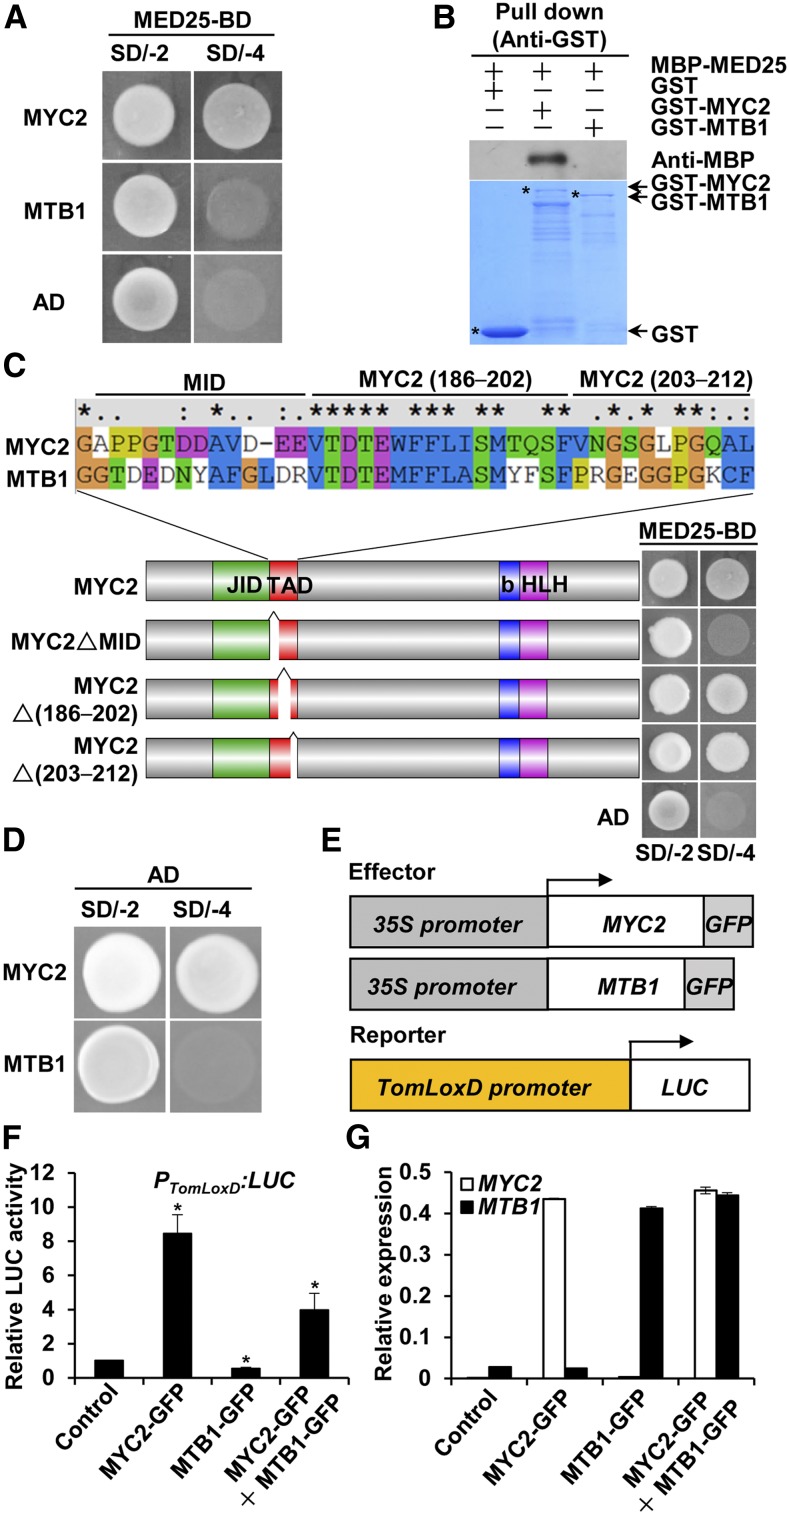
MTB Proteins Lack a Canonical MID and Act as Transcriptional Repressors.
(A) Y2H assays of the interaction of MED25 with MYC2 and MTB1. Full-length coding sequence (CDS) of MED25 was fused with the BD in pGBKT7, and full-length CDS of MYC2 or MTB1 was fused with the AD in pGADT7. Transformed yeast cells were grown on SD/-4 to determine protein-protein interactions.
(B) In vitro pull-down assays of the interaction of MED25 with MYC2 and MTB1. Purified MBP-MED25 was incubated with GST, GST-MYC2, or GST-MTB1 for the GST pull-down assay and detected by immunoblotting using anti-MBP antibody. The positions of various purified proteins separated by SDS-PAGE are marked with asterisks on the CBB-stained gel.
(C) Y2H assays of MYC2 interaction with MED25 through MID. According to the sequence alignment of the TAD of MYC2 and MTB1, MYC2 TAD was divided into three fragments labeled as MID, MYC2 (186–202), and MYC2 (203–212). Full-length MYC2 CDS and MYC2 variants lacking the MID, MYC2 (186–202), and MYC2 (203–212) fragments were fused with the AD in pGADT7, and full-length MED25 CDS was fused with the BD in pGBKT7. Transformed yeast cells were grown on SD/-4 medium to determine protein-protein interactions. Cotransformation of the AD vector with MED25 was used as a negative control.
(D) Yeast assays used to detect the transcriptional activity of MYC2 and MTB1. Yeast cells cotransformed with BD-MYC2 (or BD-MTB1) and AD vector were grown on SD/-4 medium.
(E) to (G) Transient expression assays to detect the effect of MTB1 on the transcriptional activity of MYC2.
(E) Schematic representations of effector constructs and LUC reporter construct used in transient expression assays.
(F) Quantification of luminescence intensity of LUC in N. benthamiana leaves 72 h after coinfiltration with PTomLoxD:LUC reporter construct and effector constructs or infiltration of only the PTomLoxD:LUC reporter construct (control).
(G) RT-qPCR analysis of MYC2 and MTB1 expression in N. benthamiana leaves infiltrated with the indicated constructs.
For (F) and (G), data represent means ± sd (n = 5). Statistically significant differences between control and test samples were determined using Student’s t test and are indicated using asterisks (*, P < 0.05; Supplemental Data Set 2).

