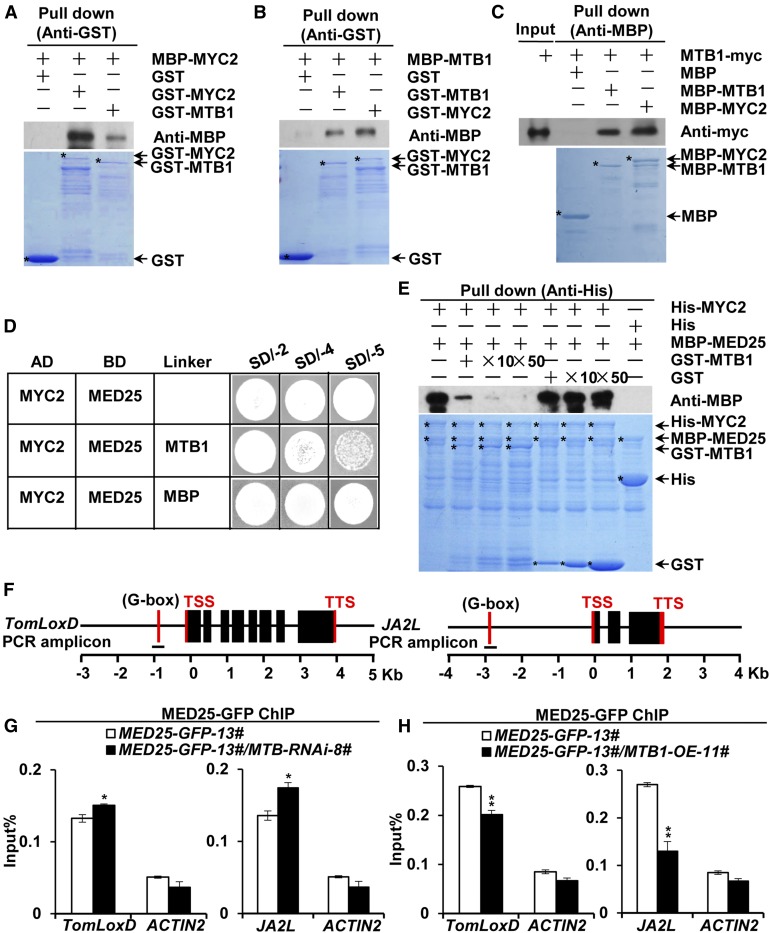
Figure 5.
MTB1 Interacts with MYC2 and Disrupts MED25-MYC2 Interaction.
(A) In vitro pull-down assays of MYC2 formation of homo- and heterodimers. Purified MBP-MYC2 was incubated with GST, GST-MYC2, or GST-MTB1 for the GST pull-down assay and detected by immunoblotting using anti-MBP antibody.
(B) and (C) Pull-down assays of MTB1 formation of homo- and heterodimers. Purified MBP-MTB1 was incubated with GST, GST-MTB1, or GST-MYC2 for the GST pull-down assay and detected by immunoblotting using anti-MBP antibody (B), and protein extracts prepared from MTB1-myc seedlings were incubated with MBP, MBP-MTB1, or MBP-MYC2 for the MBP pull-down assay and detected by immunoblotting using anti-myc antibody (C).
For (A) to (C), positions of various purified proteins separated by SDS-PAGE are indicated with asterisks on CBB-stained gels.
(D) Y3H assays showing that MTB1 interferes with MYC2-MED25 interaction. Yeast cells cotransformed with pGADT7-MYC2 and pBridge-MED25-MTB1/MBP were plated on SD/-4 medium to assess the MYC2-MED25 interaction and on SD/-5 medium to induce MTB1/MBP.
(E) In vitro pull-down assays of MTB1 interference with MED25-MYC2 interaction. Fixed amounts of His-MYC2 and MBP-MED25 fusion proteins were incubated with an increasing amount of GST-MTB1 fusion protein or GST protein. Protein samples were immunoprecipitated with anti-His antibody and immunoblotted with anti-MBP antibody.
(F) Schematic diagrams of PCR amplicons of TomLoxD and JA2L used for ChIP-qPCR. Positions of the transcription start site (TSS) and transcription termination site (TTS) are indicated.
(G) and (H) ChIP-qPCR assays of MTB-RNAi (G) and MTB1-OE (H) impairment of the enrichment of MED25 on the G-boxes of TomLoxD and JA2L promoters upon wounding. MED25-GFP-13# and MED25-GFP-13#/MTB-RNAi-8# plants (G) and MED25-GFP-13# and MED25-GFP-13#/MTB1-OE-11# plants (H) were treated with mechanical wounding for 1 h before cross-linking, and chromatin of each sample was immunoprecipitated using anti-GFP antibody. Immunoprecipitated DNAs were quantified by qPCR. The enrichment of target gene promoters is displayed as a percentage of input DNA. ACTIN2 was used as a nonspecific control. Data represent means ± sd (n = 3). Statistically significant differences between MED25-GFP-13# and other genotypes were determined using Student’s t test and are indicated using asterisks (*, P < 0.05 and **, P < 0.01; Supplemental Data Set 2).

