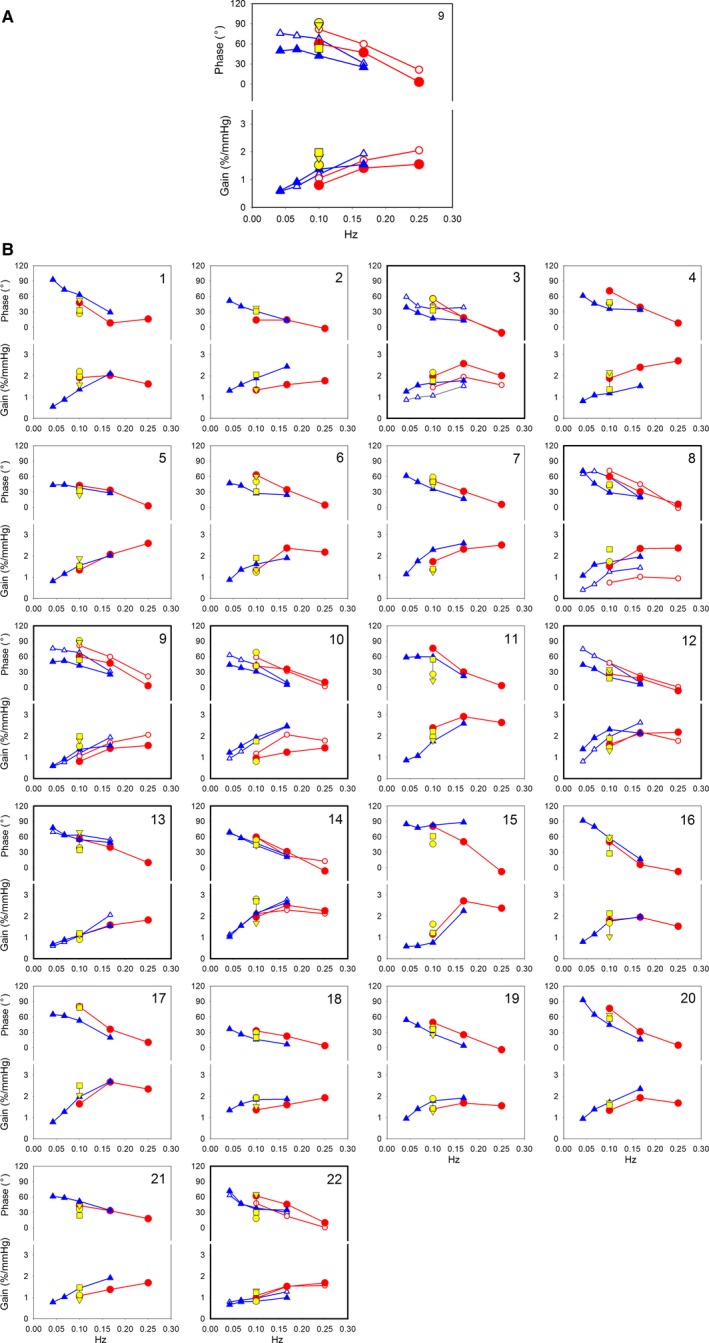
Figure 3.

(A) Bode plots in subject 9 (as an example) in 30° head‐up tilted position with first and second measurement. SinTilt: blue diamonds at 0.042, 0.067, 0.1, and 0.167 Hz. Paced breathing: red circles at 0.1, 0.167, and 0.25 Hz. First and second measurements: closed and open markers, respectively. Additional yellow markers at 0.1 Hz: phase and gain during periods of rest in three body positions during the first measurement: supine (circle), 30° HUT (triangle), and 70° HUT (square). (B) Composite figure of phase and gain for all 22 subjects in 30° head‐up tilted position. Individual Bode plots of all 22 subjects of whom eight participated twice (bold axes).
