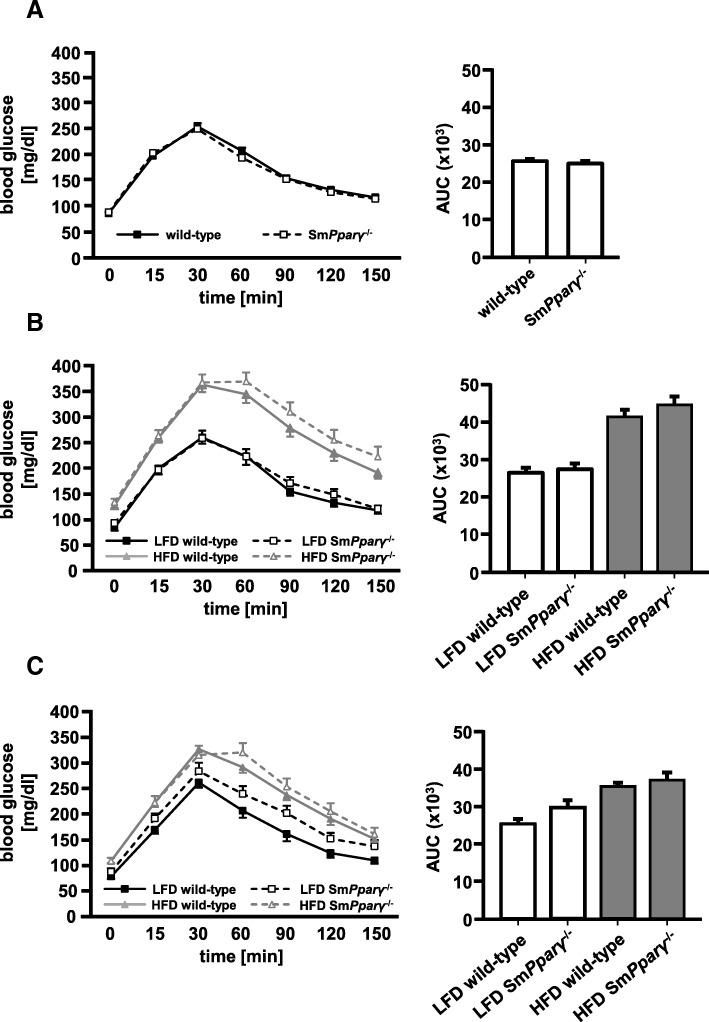
Fig. 2.
Glucose tolerance tests (GTT) were conducted after fasting a) at week 0, b) after 12 weeks of LFD and HFD, and c) after 24 weeks of LFD and HFD. The corresponding AUC (right) was calculated (n = 43–44) (a), n = 10–12 for LFD and n = 30–32 for HFD (b), n = 10–17 mice per genotype (WT and SmPparγ−/−) and diet (c). For better visualization of glucose curves, significances (p < 0.05) between LFD and HFD of the same genotypes are not depicted. A linear two factor repeated measurement model with interaction was performed. The intervention (GTT at 12 weeks) as within-subject factor was highly significant (p < 0.001). The interaction of GTT at 12 weeks with diet was significant with p < 0.001, whereas the interaction of GTT with genotype was not significant (p = 0.262). There was no three-way interaction of the GTT challenge with diet and genotype (p = 0.780). For further testing the with-in subject effects at 12 weeks testing for sphericity was performed by a Mauchly test (p = 0.057). The Huynh Feldt correction was used for the within-subject effects. The intervention (GTT at 24 weeks) as within-subject factor was significant (p < 0.001). The interaction of GTT at 24 weeks with diet was significant with p = 0.003, whereas the interaction GTT with genotype was not significant (p = 0.284). The three-way interaction of GTT with diet and genotype was not significant (p = 0.859). Homogeneity of variance between within-subject contrasts was asserted by a Levene test in GTT at 24 weeks. Significance of contrasts was assessed by an F-test. In GTT at 24 weeks the change of contrast was significant at all measurement time points (p < 0.001). Diet had a significant impact on measurements at 60, 90 and 120 min (p < 0.001, p = 0.009, p = 0.011). Genotype had a possible impact on the measurement at 60 min (p = 0.066) in GTT. There was no significant interaction of diet with genotype (p = 0.887)

