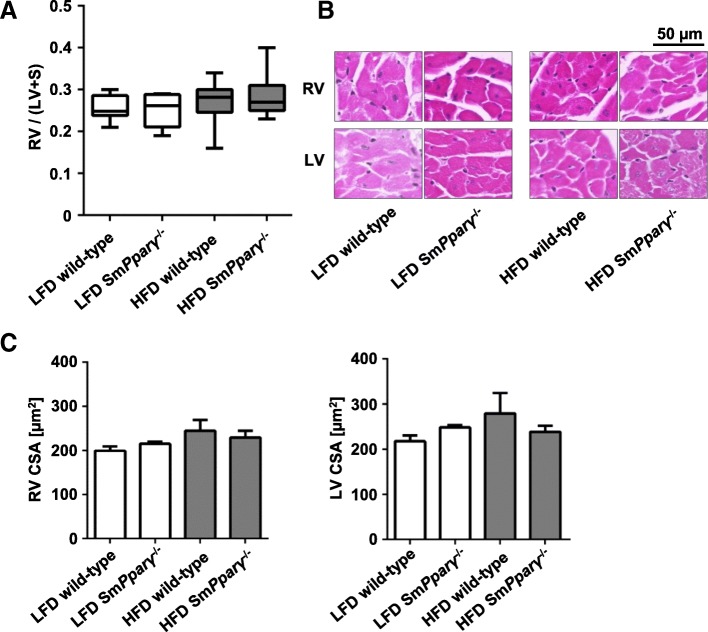
Fig. 6.
Impact of genotype (WT and SmPparγ−/−) and diet on the right (RV) and left ventricle (LV) remodelling and hypertrophy: a RV to LV + septum (S) ratios (= Fulton’s Index) from mice of each study group are shown at the 24 week time point (n = 8–15 per group). b Shown are representative hematoxylin-eosin stainings of the RV and the LV derived from all analyzed animal groups (scale bar = 50 μm). Large pictures were digitalized at × 40, insets are shown for better visualization. c Quantifications of the myocyte cross section area (in μm2) in the RV and LV in each study group (n = 16–50 myocytes / N = 4–5 animals). For a, c and d a two-factor linear model with interaction and a non-parametric Kruskal-Wallis test was performed

