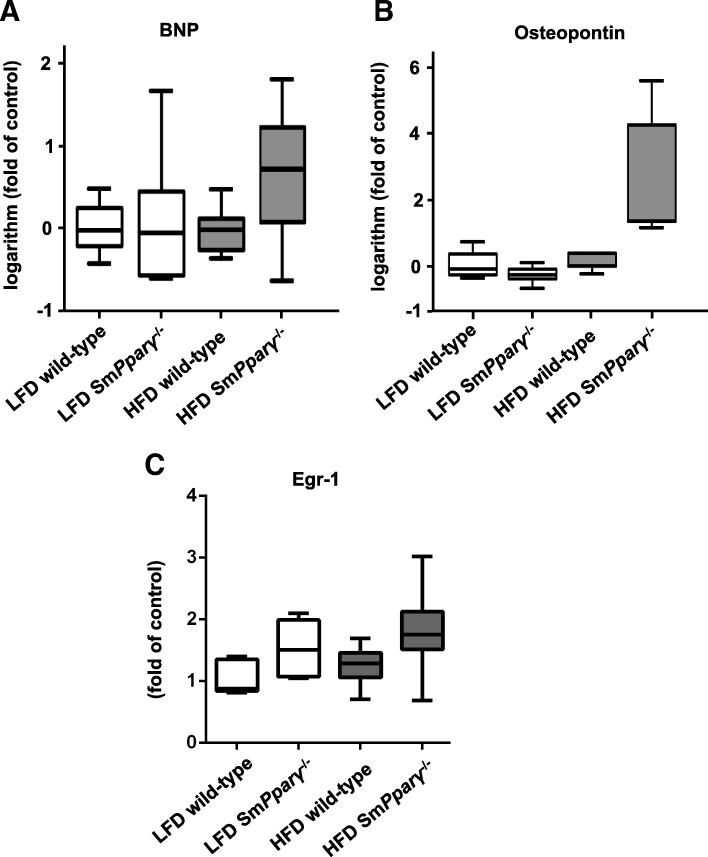
Fig. 7.
a Relative logarithmized gene expression of brain natriuretic peptide (BNP) in the right ventricle (RV) in each study group. Transcript levels were determined by qPCR analysis, and were normalized to the expression of 18S and to the expression of LFD WT mice (n = 6–8 per group). b Relative logarithmized gene expression analyses of osteopontin in the RV in each study group. Transcript levels were determined by qPCR analysis, and were normalized to the expression of 18S and to the expression of LFD WT (n = 4–6 per group). By a two-factor linear model with interaction and a non-parametric Kruskal-Wallis test we detected that diet had a significant effect on osteopontin (p = 0.01) with borderline interaction with genotype (p = 0.06). c Relative gene expression analyses of Egr-1 in the RV in each study group. Transcript levels were determined by qPCR analysis, and were normalized to the expression of 18S. The expression of LFD WT mice was arbitrarily set as 1 (n = 6–7 per group). By a two-factor linear model with interaction and a non-parametric Kruskal-Wallis test we detected that the genotype had a significant effect on Egr-1 (p = 0.019)

