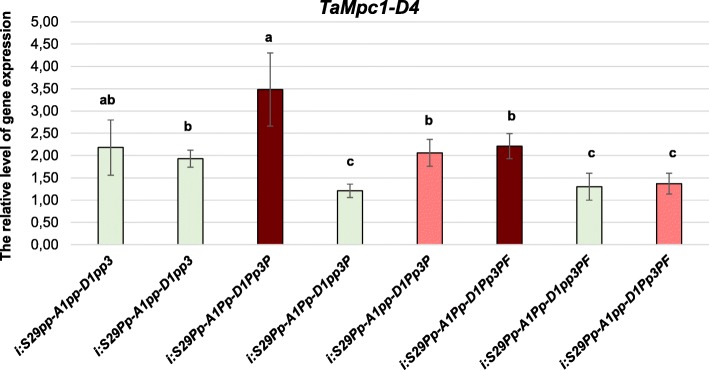
Fig. 4.
The expression of TaMpc1-D4 in wheat pericarps having different colouration. The colour of the column corresponds to the colour of wheat coleoptile. The data represent the means ± standard error of three biological replicates. Statistical significance was determined by one-way analysis of variance. Significant differences between means are indicated where letters above the bars differ (p ≤ 0.05)

