
Fig. 11.
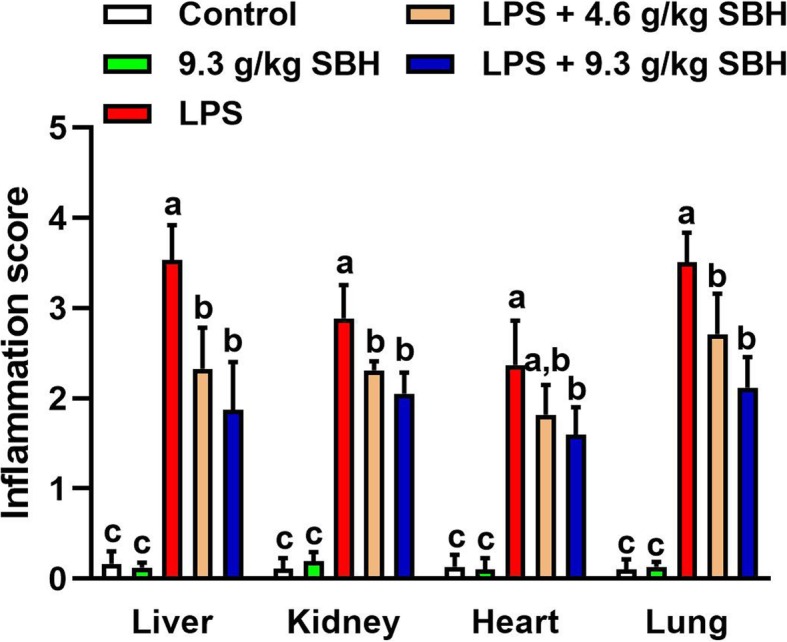
Inflammation score of the liver, kidney, heart and lung of SBH-supplemented control and LPS-induced rats. Data are mean ± standard error of the mean (n = 6). Significantly different values are indicated by different superscripts
Official websites use .gov
A
.gov website belongs to an official
government organization in the United States.
Secure .gov websites use HTTPS
A lock (
) or https:// means you've safely
connected to the .gov website. Share sensitive
information only on official, secure websites.
Inflammation score of the liver, kidney, heart and lung of SBH-supplemented control and LPS-induced rats. Data are mean ± standard error of the mean (n = 6). Significantly different values are indicated by different superscripts