
Fig. 3.
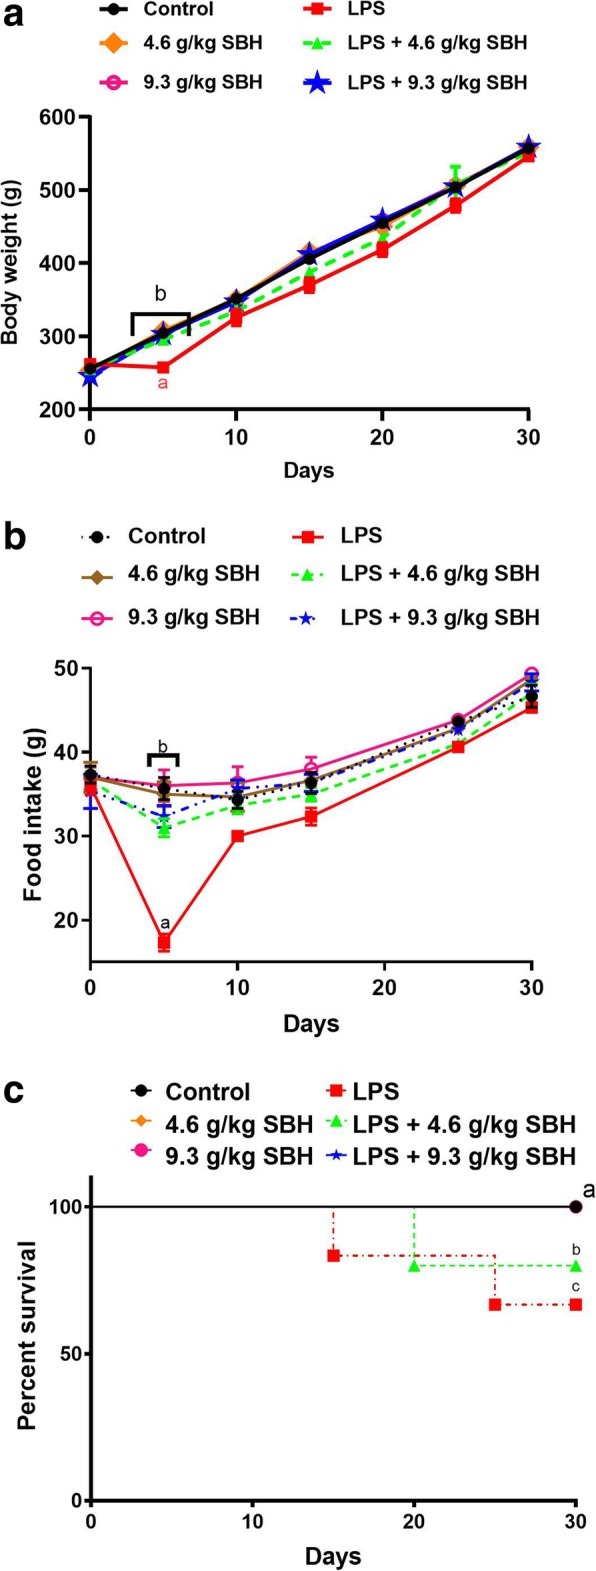
Effect of SBH on (a) body weight changes, (b) food intake and (c) survival rate in control and LPS-induced rats. Data are mean ± standard error of the mean (n = 6). Significantly different values are indicated by different superscripts
Official websites use .gov
A
.gov website belongs to an official
government organization in the United States.
Secure .gov websites use HTTPS
A lock (
) or https:// means you've safely
connected to the .gov website. Share sensitive
information only on official, secure websites.
Effect of SBH on (a) body weight changes, (b) food intake and (c) survival rate in control and LPS-induced rats. Data are mean ± standard error of the mean (n = 6). Significantly different values are indicated by different superscripts