Fig. 3.
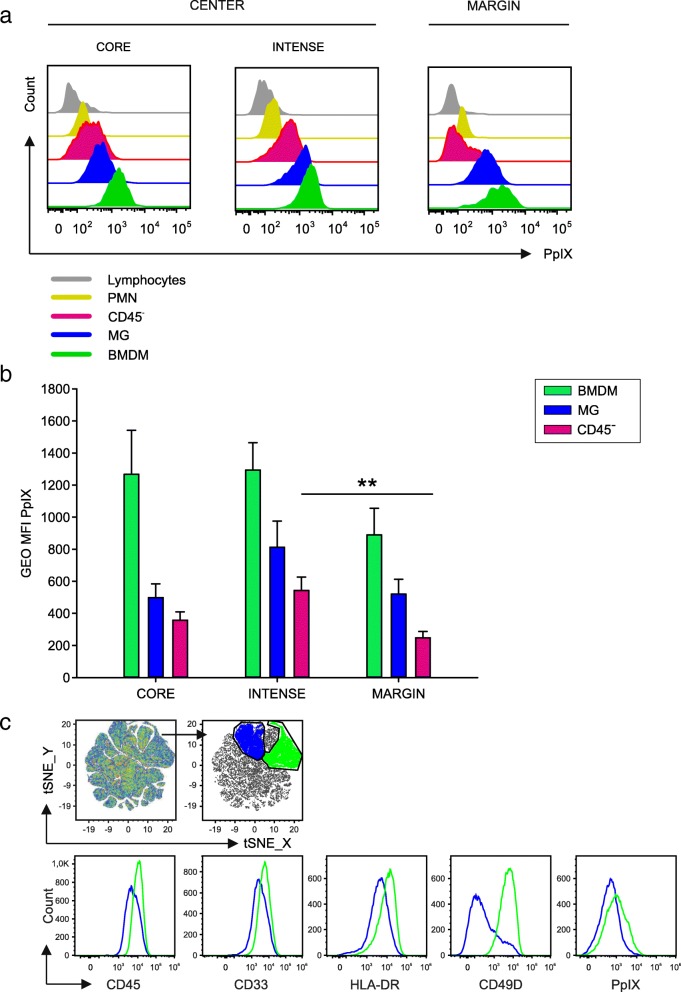
Fluorescence emission of PpIX from cell subsets in the tumor microenvironment. a Representative flow cytometry plot and (b) cumulative analysis of 5-ALA fluorescence emission by CD45− cells (pink), MG (blue) and BMDM (green) (n = 15 core samples, n = 21 intense fluorescence samples and n = 13 margin samples). c t-SNE analysis of live cells infiltrating the intense fluorescence layer (n = 11 samples) of GBM patients. Combined analysis on the following parameters: CD45, CD33, HLA-DR, CD49D, PPIX. In the two main clusters obtained after t-SNE analysis (blue and green populations), the expression of the single markers was analyzed (blue and green histograms). Comparison by Mann-Whitney test, **p < 0.01

