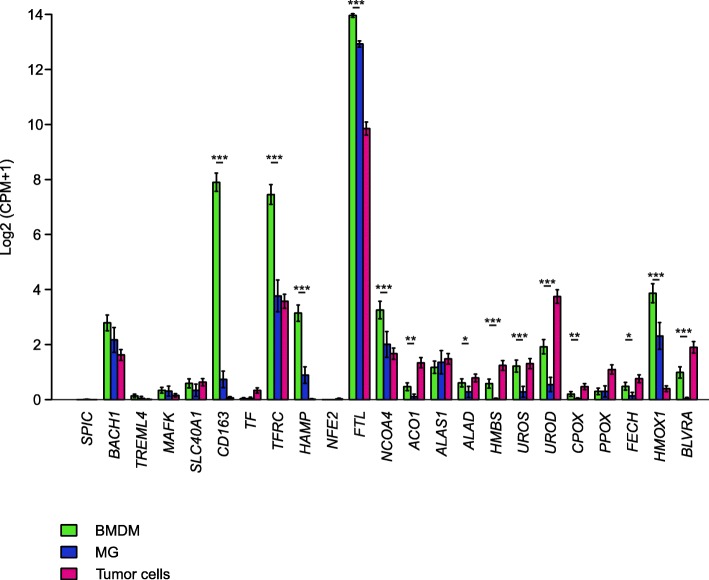
Fig. 4.
Gene expression analysis of genes involved in heme metabolism in BMDM (green), MG (blue) and tumor cells (pink). Expression of heme-iron metabolism genes obtained from scRNAseq of neoplastic and immune cells from primary gliomas. Both whole tumor and CD11b-purified single-cells suspensions were subjected to scRNA-seq. Bars denote mean expression and whiskers denote the standard error of the mean. Significance assessed via a t-test, *p < 0.05, **p < 0.01, ***p < 0.001

