
Fig. 5.
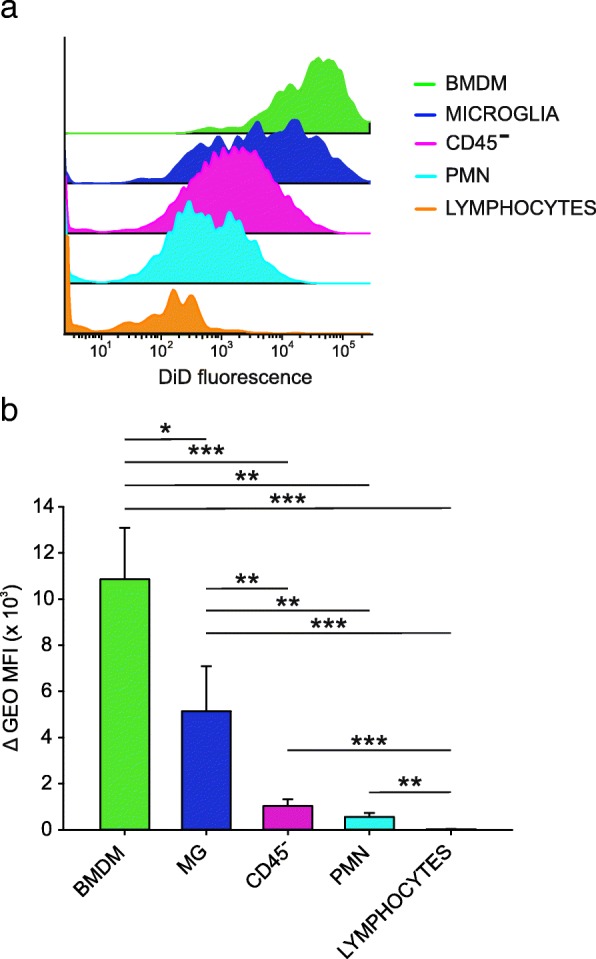
Uptake of LNCs loaded with DiD by cell subsets in GBM. a Representative example showing DiD fluorescence intensity of different leukocyte populations and CD45− tumor cells after over-night incubation with DiD-loaded LNCs of cell suspensions. b Fluorescence intensities of DiD-loaded LNCs and blank-LNCs in different GBM subsets. N = 9 for BMDM, MG, CD45− tumor cells and lymphocytes; n = 6 for PMN. Mean and SE are reported; Mann-Whitney U test *p < 0.05, **p < 0.01, ***p < 0.001