
Fig. 4.
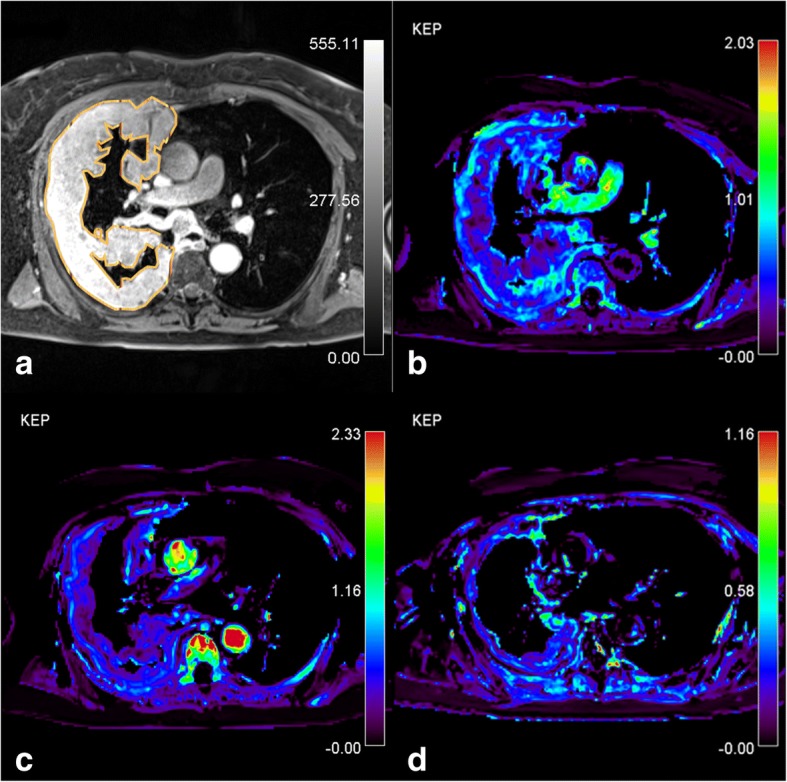
Patient with partial response. a) Post-contrast T1-weighted turbo-FLASH. Source image shows the region of interest (ROI) drawn around the tumor, AATH-calculated kep parametric map (1/min) from b) pre-treatment c) intra-treatment and d) post-treatment study are shown. Tumor reduced in size which was flowed by a reduction in the kep during the course of chemotherapy. The distribution of the kep is spatially heterogenous with high values in the periphery and low values in the core