Fig. 4.
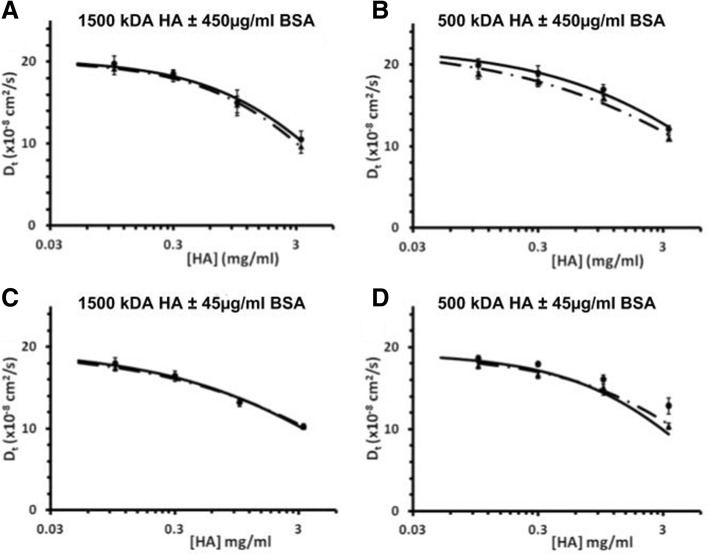
Tracer diffusion coefficients of FITC-dextran (2000 kDa) through 1500 kDa HA solutions ±450 μg/ml BSA (∆ for HA + BSA, ● for HA) (a), 500 kDa HA solutions ±450 μg/ml BSA (b); 1500 kDa HA solutions ±45 μg/ml BSA (c), 500 kDa HA solutions ±45 μg/ml BSA (d). Data points are fit to the universal scaling equation (dashed lines = HA + BSA, solid lines = HA). At 450 μg/ml BSA, in both 1500 and 500 kDa HA (a, b) the diffusion of the tracer was significantly affected by HA concentration (both p < 0.01) but not the presence of BSA (p = 0.39 and 0.11 respectively), with no interaction effect (p = 0.49 and 1.0 respectively). At 45 μg/ml BSA, in both 1500 and 500 kDa HA (c, d) the diffusion of the tracer through 1500 kDa HA was significantly affected by HA concentration (both p < 0.01) but not the presence of BSA (p = 0.95 and 0.73 respectively), with no interaction effect (p = 0.99 and 0.372, respectively)

