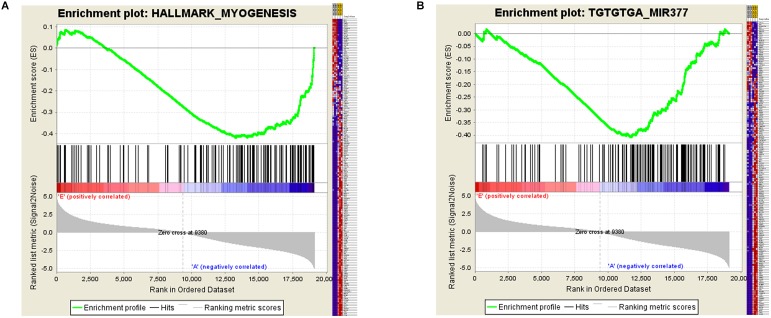
FIGURE 5.
Gene Set Enrichment Analysis (GSEA) of mRNA expression levels in bovine skeletal muscle. (A and B) GSEA result using HALLMARK_MYOGENESIS (A) and C3 MIR gene sets (B) Left panel: X-axis label represents “E”(Embryonic stage)/“A”(Adult stage) level, and Y-axis label represents the enrichment score of these mRNAs. Right panel: heat map of related mRNAs expression in two stages.

