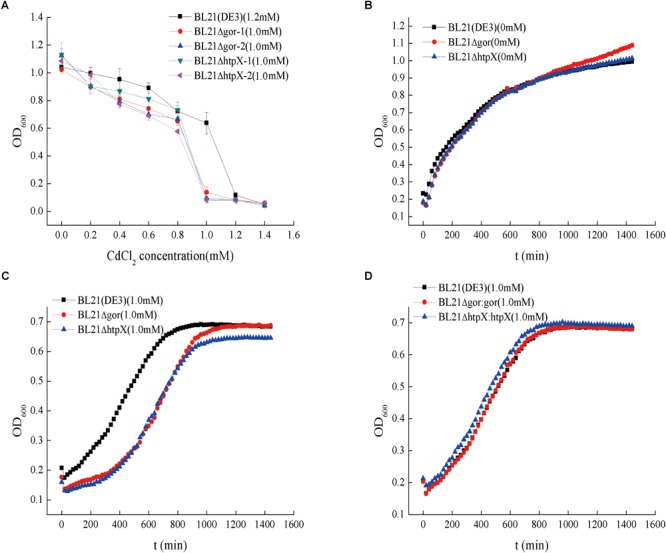
FIGURE 5.

Cadmium resistance capacities and growth curves of knockout strains and plasmid remedial strains. The symbol “Δ” represents gene knockout. (A) Cadmium resistance capacities of the knockout strains, with BL21 as a control; BL21Δgor-1 and BL21Δgor-2 represent gor knockout strains. The 0.8 and 1.0 mM represent the cadmium MIC values. (B) Growth curves of the knockout strains without cadmium pressure. (C) Growth curves of the knockout strains with 1.0 mM cadmium ions. (D) Growth curves of the plasmid remedial strains with 1.0 mM cadmium ions. For the cadmium MIC assay (A), 10-μL aliquots of overnight cultures of highly cadmium-resistant strains were transferred into 96-well plates (each well contained 1,000 μL of LB medium); for the growth assay (B–D), 6-μL aliquots of overnight cultures were diluted into 100-well plates containing 350 μL of LB medium. The OD600 of the cell was measured with the instrument Bioscreen C every 20 min. The growth curve was the average value of 10 replicates.
