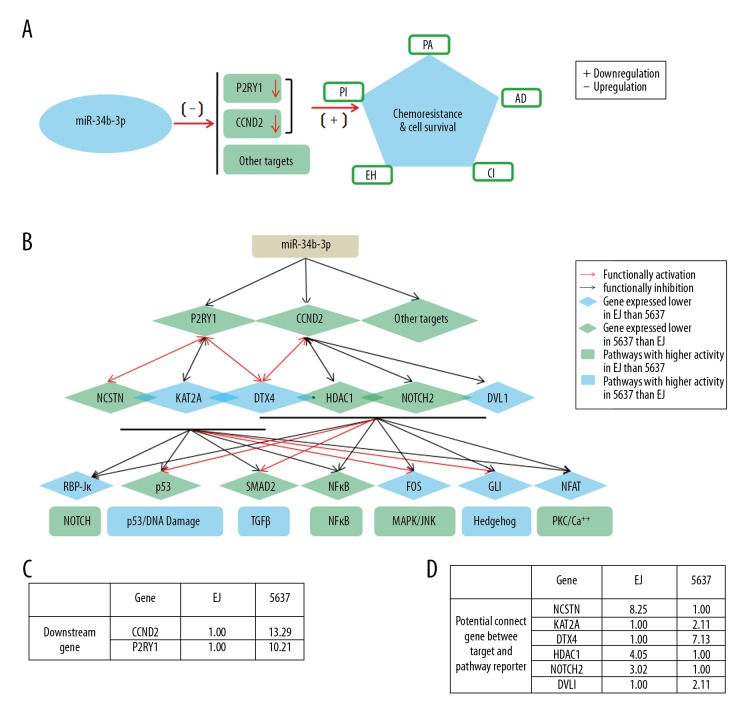
Figure 7.
The working model for the role of miR-34b-3p in the regulation of the chemoresistance of BCa cells by repression of CCND2 and P2RY1. (A) The expression of CCND2 and P2RY1 genes under the negative regulation of miR-34b-3p is positively correlated with the chemoresistance to the 5 indicated chemotherapeutics. (B) Network model: the lines signify the potential interactions between genes obtained from GeneMANIA (http://genemania.org/). The green diamond nodes indicate genes expressed at a lower level in 5637 cells than in EJ cells; the green rectangle nodes indicate the pathways with higher activity in EJ cells than in 5637 cells. The blue diamond nodes indicate genes expressed at a lower level in EJ cells than in 5637 cells; the blue rectangle nodes indicate the pathways with higher activity in 5637 cells than in EJ cells. Seven pathways (transcription factor): Notch (RBP-Jκ), p53/DNA damage (p53), TGFβ (SMAD2/3/4), NFκB (NFκB), MAPK/JNK (FOS/JUN), Hedgehog (GLI), and PKC/Ca++ (NFAT). (C) The relative expression levels of the downstream genes CCND2 and P2RY1 are summarized in the table. (D) The relative expression levels of the potential connecting genes (NCSTN, KAT2A, DTX4, HDAC1, NOTCH2, and DVL1) between the targets and pathway reporter are summarized. BCa – bladder cancer; CCND2 – G1/S-specific cyclin-D2; P2RY1 – purinergic receptor P2Y1.

