
Figure 3.
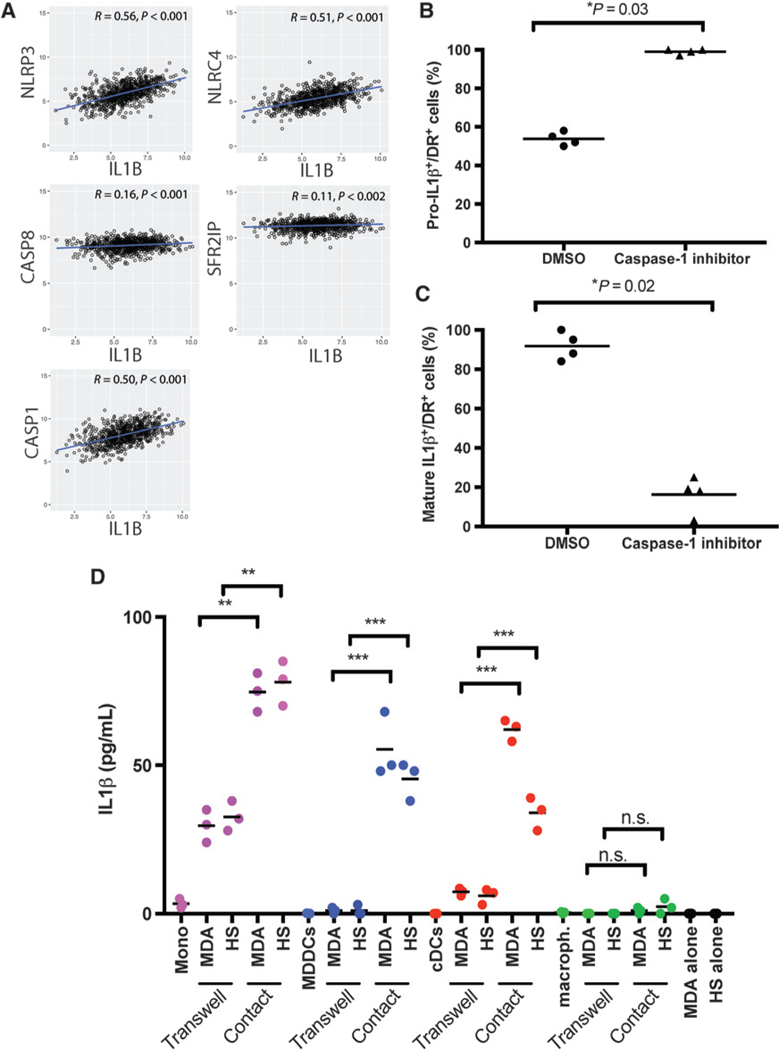
IL1β production in DCs is caspase-1 and contact dependent. A, Scatter plots with line of best fit and Spearman correlation (r) of IL1B with NLRP3, NLRC4, caspase-1 (CASP1), caspase-8 (CASP8), and caspase-11 (SFRS2IP) expression in TCGA dataset (870 patients). B and C, MDA-MB-231 breast cancer cells and cDCs were cocultured in chamber wells for 18 hours, in the presence of caspase-1 inhibitor or DMSO. The percentage of HLA-DR+ cells showing expression of pro-IL1β (B) or that of mature IL1β (C). D, MDA-MB-231 (MDA) or Hs578T (HS) breast cancer cells cocultured with blood monocytes (Mono), MDDCs, cDCs, or monocyte-derived macrophages (macroph.) in regular tissue culture wells (Contact) or Transwell to separate two types of cells in culture for 48 hours. IL1β levels in supernatants by Luminex. Values are plotted as mean ± SEM from triplicate experiments. Welch t test was used. n.s., not significant.