
Figure 4.
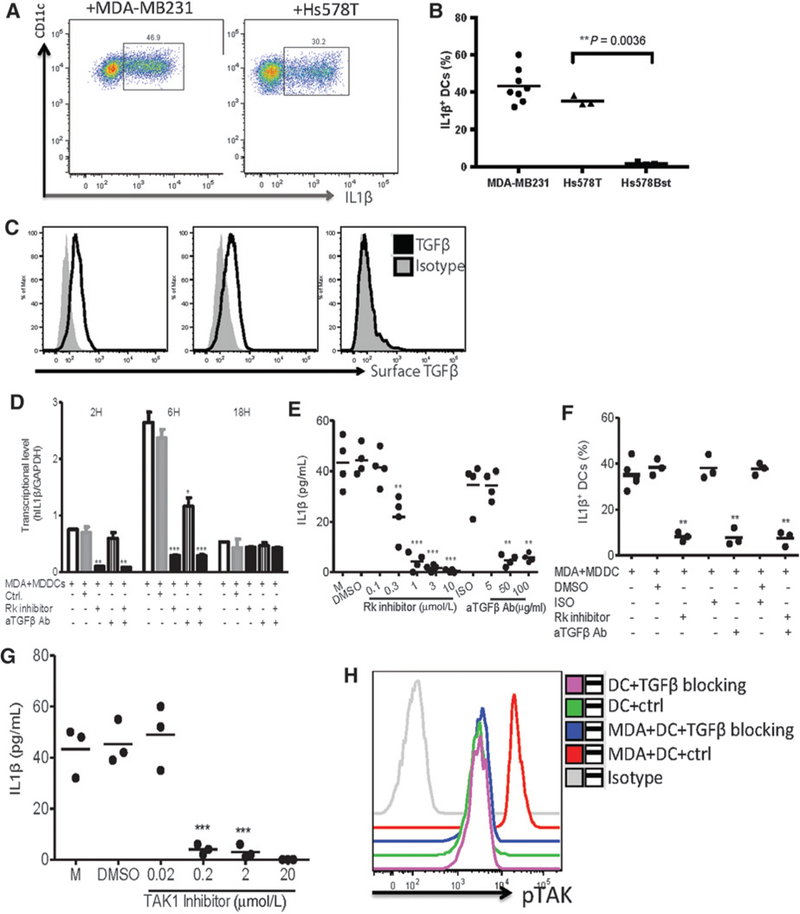
IL1β production in cDCs and monocytes is triggered by TGFβ. A, cDCs were cocultured with MDA-MB-231 breastcancercellsorHs578T breast cancer cells for 16 hours. Intracellular IL1β expression in gated viable cells by FACS. B, Summary of the percentage of IL1β+ cDCs. Each dot represents one experiment. C, Surface expression of activated TGFβ1 by flow cytometry in breast cancer cell lines and nonmalignant cells. D, MDA-MB-231 cells were cocultured with DCs for 48 hours, in presence of different doses of TGFβR kinase inhibitor or anti-TGFβ neutralizing antibody, DMSO, or isotype control, respectively. Histograms of IL1B transcription levels analyzed by quantitative RT-PCR, normalized to GAPDH. Bars show the mean ± SEM for triplicate wells from a representative experiment. Kruskall- Wallis test was used. *, P < 0.05; **, P < 0.01; ***, P < 0.0001. n.s., not significant. E, IL1β level in supernatants by Luminex. Values are plotted as mean ± SEM (independent t test was used). F, Same conditions as in E, but over a 16-hour culture period and with the readout being fraction of total DCs being IL1β+. Intracellular staining of culture with anti-IL1β antibody by flow cytometry. Each dot represents one experiment. G, MDA-MB-231 cells were cocultured with cDCs for 48 hours in presence of different doses of TAK1 inhibitor or DMSO. IL1β levels in the supernatants after 48 hours of coculture by Luminex. Each dot represents one experiment. H, cDCs were cocultured with MDA-MB-231 cells in presence or absence of anti-TGFβ neutralizing antibody plus TGFβR kinase inhibitor (TGFβ blocking) for 60 minutes; pTAK1 was detected by specific staining and analyzed on FACS.