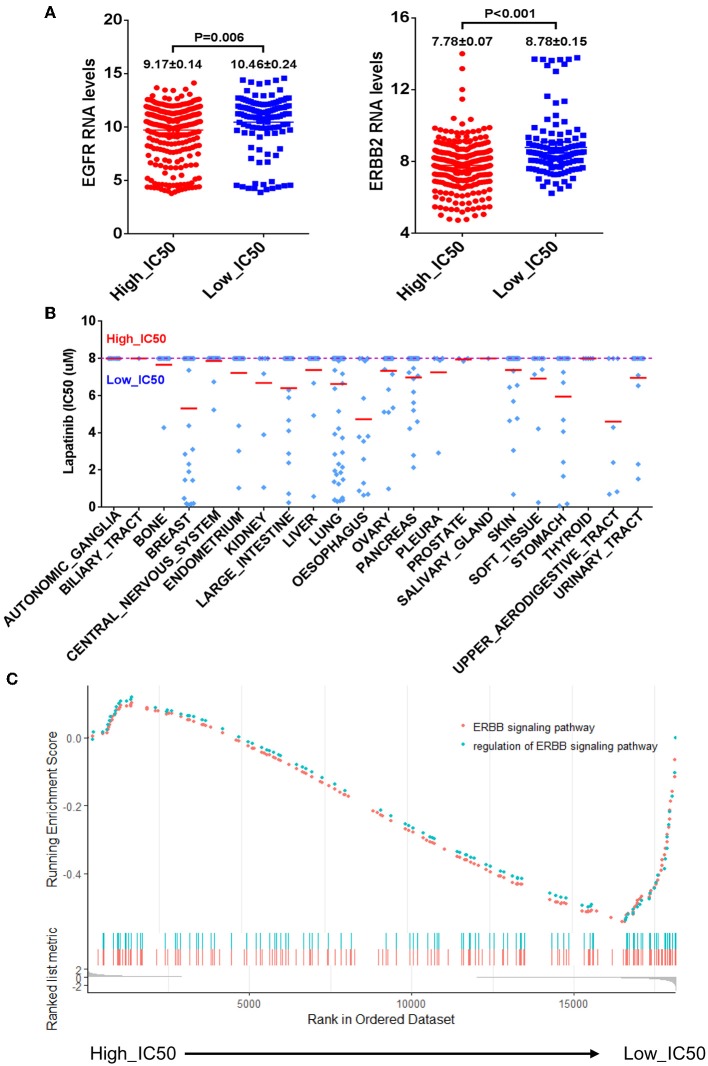
Figure 1.
The correlation of mRNA expression levels of EGFR and ERBB2 and Lapatinib IC50. (A) The bar charts of mRNA expression levels of EGFR (left) and ERBB2 (right) of cancer cell lines between the high_IC50 and low_IC50 groups of Lapatinib drug. The expression levels of EGFR and ERBB2 are significantly higher in the low_IC50 group than that in the high_IC50 group (p < 0.01). (B) The distribution tendency of 22 types of solid cancer cell lines in high-IC50 (up to 8 μM) and low_IC50 (lower than 8 μM). The red lines represent mean value of Lapatinib IC50. (C) The enrichment analysis of ERBB signaling pathway reveals that ERBB signaling pathway is significantly enriched in Lapatinib low_IC50 group. “Y” axis indicates the enrichment score (ES) value, and “X” axis indicates genes according to differential expression value between high_IC50 and low_IC50 groups. The blue and red dot curves represent ES value. The bottom barcodes represent the leading gene set that strongly contributed to ES value. The positive ES value represents positive correlation to Lapatinib IC50, and minus ES value represents negative correlation to Lapatinib IC50.

