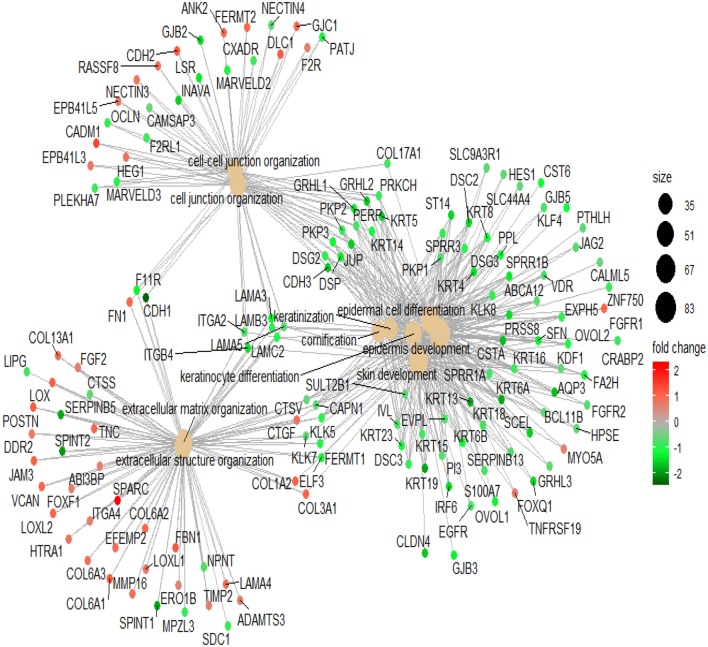
Figure 5.
Pathway analysis of Lapatinib sensitivity related genes. The genes in the top 10 pathways with fold-change more than 1.5 are used between Lapatinib high_IC50 and low_IC50 groups. The middle brown dot of each network indicates the name of a gene set, and the small dots surrounding it indicate the genes of the gene set. The red dots represent the up-regulated genes in the high_IC50 group, and the green dots represent the up-regulated genes in the low_IC50 group. The darker red or green spot are the larger fold-change of differential genes. The black spots with different sizes and numbers on the right side indicate the gene numbers in the gene clusters.

