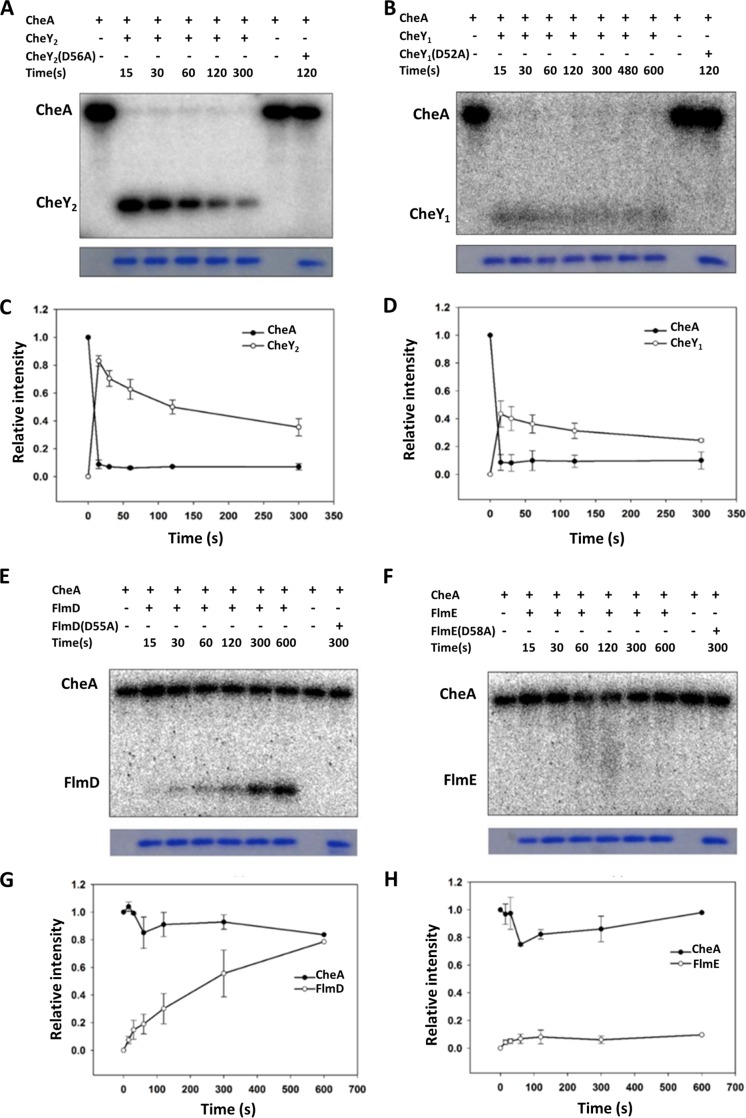
FIG 4.
The phosphoryl group transfers from CheA to CheY1, CheY2, and FlmD. (A to H) Representative phosphotransfer images (A, B, E, and F) and time courses of the phosphotransfer from CheA-P to CheY1, CheY2, FlmD, and FlmE (C, D, G, and H). The data are presented as the mean values of three independent experiments. Error bars represent the standard deviations (SD).

