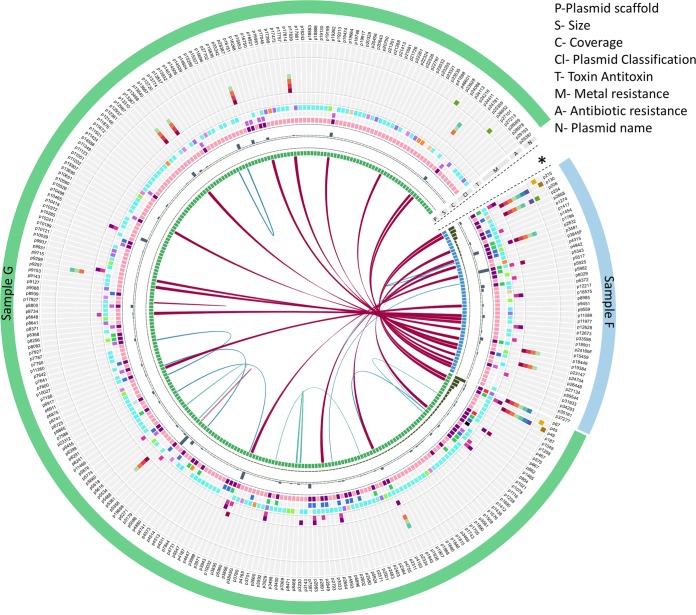
FIG 7.
Visualization of circular plasmids of interest from the groundwater samples F (blue) and G (green). Cutoff values for blast are E value of e−5 and minimum match of 1,000 bp (97%> = magenta, 90%> = blue, and 80%> = teal). Rings 2 and 3 depict histograms corresponding to the scaffold size and sequence coverage, respectively. Ring 4 depicts plasmid mobility (the colors light pink, pink, and violet represent nonmobilizable, mobilizable, and conjugative, respectively), ring 5 depicts MOB type (the colors blue, green, purple, red, black, orange, and light blue represent MOBP, MOBQ, MOBV, MOBF, MOBC, MOBB, and MOBT, respectively), ring 6 depicts incompatibility groups (the colors teal, purple, blue, green, cream, pink, and orange represent IncA/C cgPMLST, IncA/C cgPMLST or IncA/C PMLST, IncF RST, Inc HI1 MLST, Inc HI2 DLST, IncI1 MLST, and IncN MLST, respectively), and rings 7 (pink) and 8 (purple) depict presence of toxin and antitoxin, respectively. Rings 9 to 15 depict presence of genes annotated (by KBase) to provide resistance to metals (the colors carmine, red, orange, light green, light blue, dark blue, and purple represent mercury, lead, cadmium, zinc, cobalt, copper, and arsenic, respectively), and rings 16 to 18 depict presence of genes annotated (by KBase) to provide resistance to antibiotics (the colors green, yellow, and brown represent acriflavine, polymyxin, and fosfomycin, respectively). The outermost ring depicts the plasmid name. The plot was created using Circos and Circoletto (64, 65). The asterisk indicates the circular plasmids not depicted on the figure because of lack of similarity with other plasmids and the lack of identifying features in rings 5 through 18.

